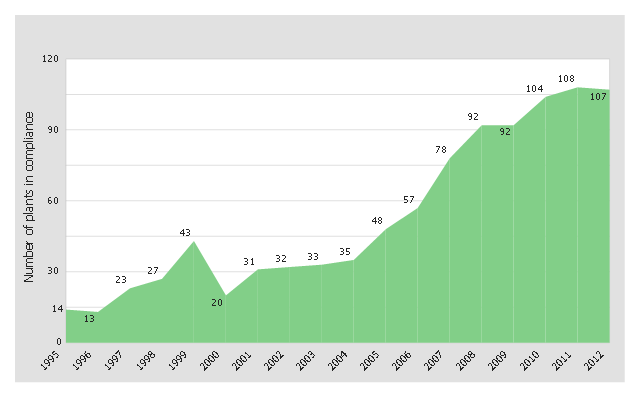
This area chart sample was redesigned from the picture "Outstanding trends of wastewater treatment plants" from the Washington State Department of Ecology website.
[ecy.wa.gov/ programs/ wq/ wastewater/ op_ cert/ kudos.html]
"Sewage treatment is the process of removing contaminants from wastewater and household sewage, both runoff (effluents), domestic, commercial and institutional. It includes physical, chemical, and biological processes to remove physical, chemical and biological contaminants. Its objective is to produce an environmentally safe fluid waste stream (or treated effluent) and a solid waste (or treated sludge) suitable for disposal or reuse (usually as farm fertilizer). Using advanced technology it is now possible to re-use sewage effluent for drinking water, although Singapore is the only country to implement such technology on a production scale in its production of NEWater." [Sewage treatment. Wikipedia]
The area graph example "Outstanding trends of wastewater treatment plants" was created using the ConceptDraw PRO diagramming and vector drawing software extended with the Area Charts solution from the Graphs and Charts area of ConceptDraw Solution Park.
Area chart
This arrow loop cycle diagram sample was created on the base of the figure illustrating the webpage "Exploratory Advanced Research Program Hand-Off Workshops" from the US Department of Transportation - Federal Highway Administration (FHWA) website. "The FHWA’s research and technology innovation life cycle illustrates that research and technology development are not insular activities, but integrated processes that together constitute a system.
Following general workshop discussion, a number of common issues emerged among the groups. These centered around the research life cycle, communicating the value of exploratory advanced research, and continued project funding. It was felt that there is a general need to better describe the research and deployment cycle specific to highway transportation and possibly to highway research fields, such as materials or system planning. Research life cycle diagrams show a very linear, chronological process but it is not necessarily that way in reality." [fhwa.dot.gov/ advancedresearch/ pubs/ 11034/ ]
The arrow loop diagram example "Innovation life cycle" was created using the ConceptDraw PRO diagramming and vector drawing software extended with the Target and Circular Diagrams solution from the Marketing area of ConceptDraw Solution Park.
www.conceptdraw.com/ solution-park/ marketing-target-and-circular-diagrams
Arrow loop cycle diagram
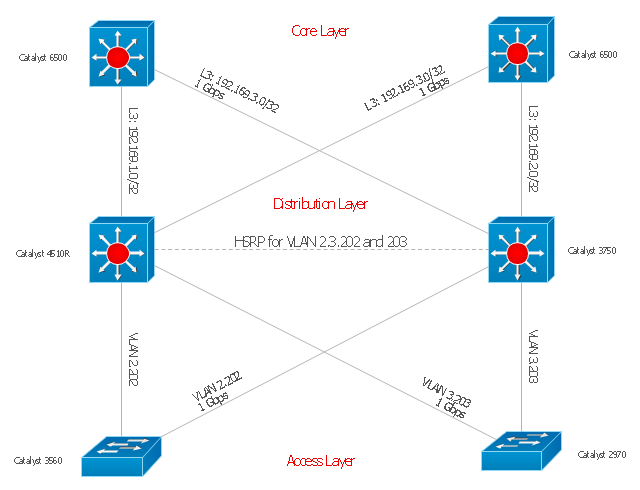
"Cisco Express Forwarding (CEF) is an advanced layer 3 switching technology used mainly in large core networks or the Internet to enhance the overall network performance. Although CEF is a Cisco proprietary protocol other vendors of multi-layer switches or high-capacity routers offer a similar functionality where layer-3 switching or routing is done in hardware (in an ASIC) instead of by software and the (central) CPU." [Cisco Express Forwarding. Wikipedia]
The computer network topology diagram example "Cisco Express Forwarding" was created using the ConceptDraw PRO diagramming and vector drawing software extended with the Cisco Network Diagrams solution from the Computer and Networks area of ConceptDraw Solution Park.
The computer network topology diagram example "Cisco Express Forwarding" was created using the ConceptDraw PRO diagramming and vector drawing software extended with the Cisco Network Diagrams solution from the Computer and Networks area of ConceptDraw Solution Park.
Network topology diagram
This circular arrows diagram sample shows advanced persistent threat lifecycle.
It was designed on the base of the Wikimedia Commons file: Advanced persistent threat lifecycle.jpg.
[commons.wikimedia.org/ wiki/ File:Advanced_ persistent_ threat_ lifecycle.jpg]
This file is licensed under the Creative Commons Attribution-Share Alike 3.0 Unported license. [creativecommons.org/ licenses/ by-sa/ 3.0/ deed.en]
"Advanced Persistent Threat (APT) APT is a set of stealthy and continuous hacking processes often orchestrated by human targeting a specific entity. APT usually targets organizations and or nations for business or political motives. APT processes require high degree of covertness over a long period of time. As the name implies, APT consists of three major components/ processes: advanced, persistent, and threat. The advanced process signifies sophisticated techniques using malware to exploit vulnerabilities in systems. The persistent process suggests that an external command and control is continuously monitoring and extracting data off a specific target. The threat process indicates human involvement in orchestrating the attack.
APT usually refers to a group, such as a government, with both the capability and the intent to persistently and effectively target a specific entity. The term is commonly used to refer to cyber threats, in particular that of Internet-enabled espionage using a variety of intelligence gathering techniques to access sensitive information, but applies equally to other threats such as that of traditional espionage or attack. Other recognized attack vectors include infected media, supply chain compromise, and social engineering. Individuals, such as an individual hacker, are not usually referred to as an APT as they rarely have the resources to be both advanced and persistent even if they are intent on gaining access to, or attacking, a specific target." [Advanced persistent threat. Wikipedia]
The arrow donut chart example
"Advanced persistent threat lifecycle" was created using the ConceptDraw PRO diagramming and vector drawing software extended with the Circular Arrows Diagrams solution from the area "What is a Diagram" of ConceptDraw Solution Park.
Circular arrows diagram

HelpDesk
How to Add a Telecommunication Network Diagram to a MS Word Document Using ConceptDraw PRO

- Outstanding trends of wastewater treatment plants | Building ...
- Outstanding trends of wastewater treatment plants | United States ...
- Outstanding trends of wastewater treatment plants | Line Graph ...
- Types of Flowcharts | Outstanding trends of wastewater treatment ...
- Technologies Of Cloud Computing
- What Is Cloud Server Technology
- ConceptDraw Arrows10 Technology | How to Make Audio and Video ...
- Program to Make Flow Chart | Innovation life cycle - Arrow loop ...
- Create Flow Chart on Mac | Flow Diagram Software | Process Flow ...
- How To Create a Flow Chart in ConceptDraw | ConceptDraw ...
- Domestic sector SWOT | Pie chart - Domestic energy consumption ...
- Process Flowchart | Flow Diagram Software | Technical Drawing ...
- Process Flowchart | Flow Diagram Software | Best Program to Make ...
- Bubble Chart Maker | How To Create a Bubble Chart | Flow Diagram ...
- Flow Diagram Software | Flow Chart Symbols | Flowchart Program ...
- Flow Diagram Software | Flowchart Program Mac | Easy Flowchart ...
- Business Diagram Software | Business People Figures | Use Case ...
- How To Create a Flow Chart in ConceptDraw | Use the Best ...
- Metropolitan area networks (MAN). Computer and Network ...
- Network Security Devices | Government Cloud | Cisco security ...