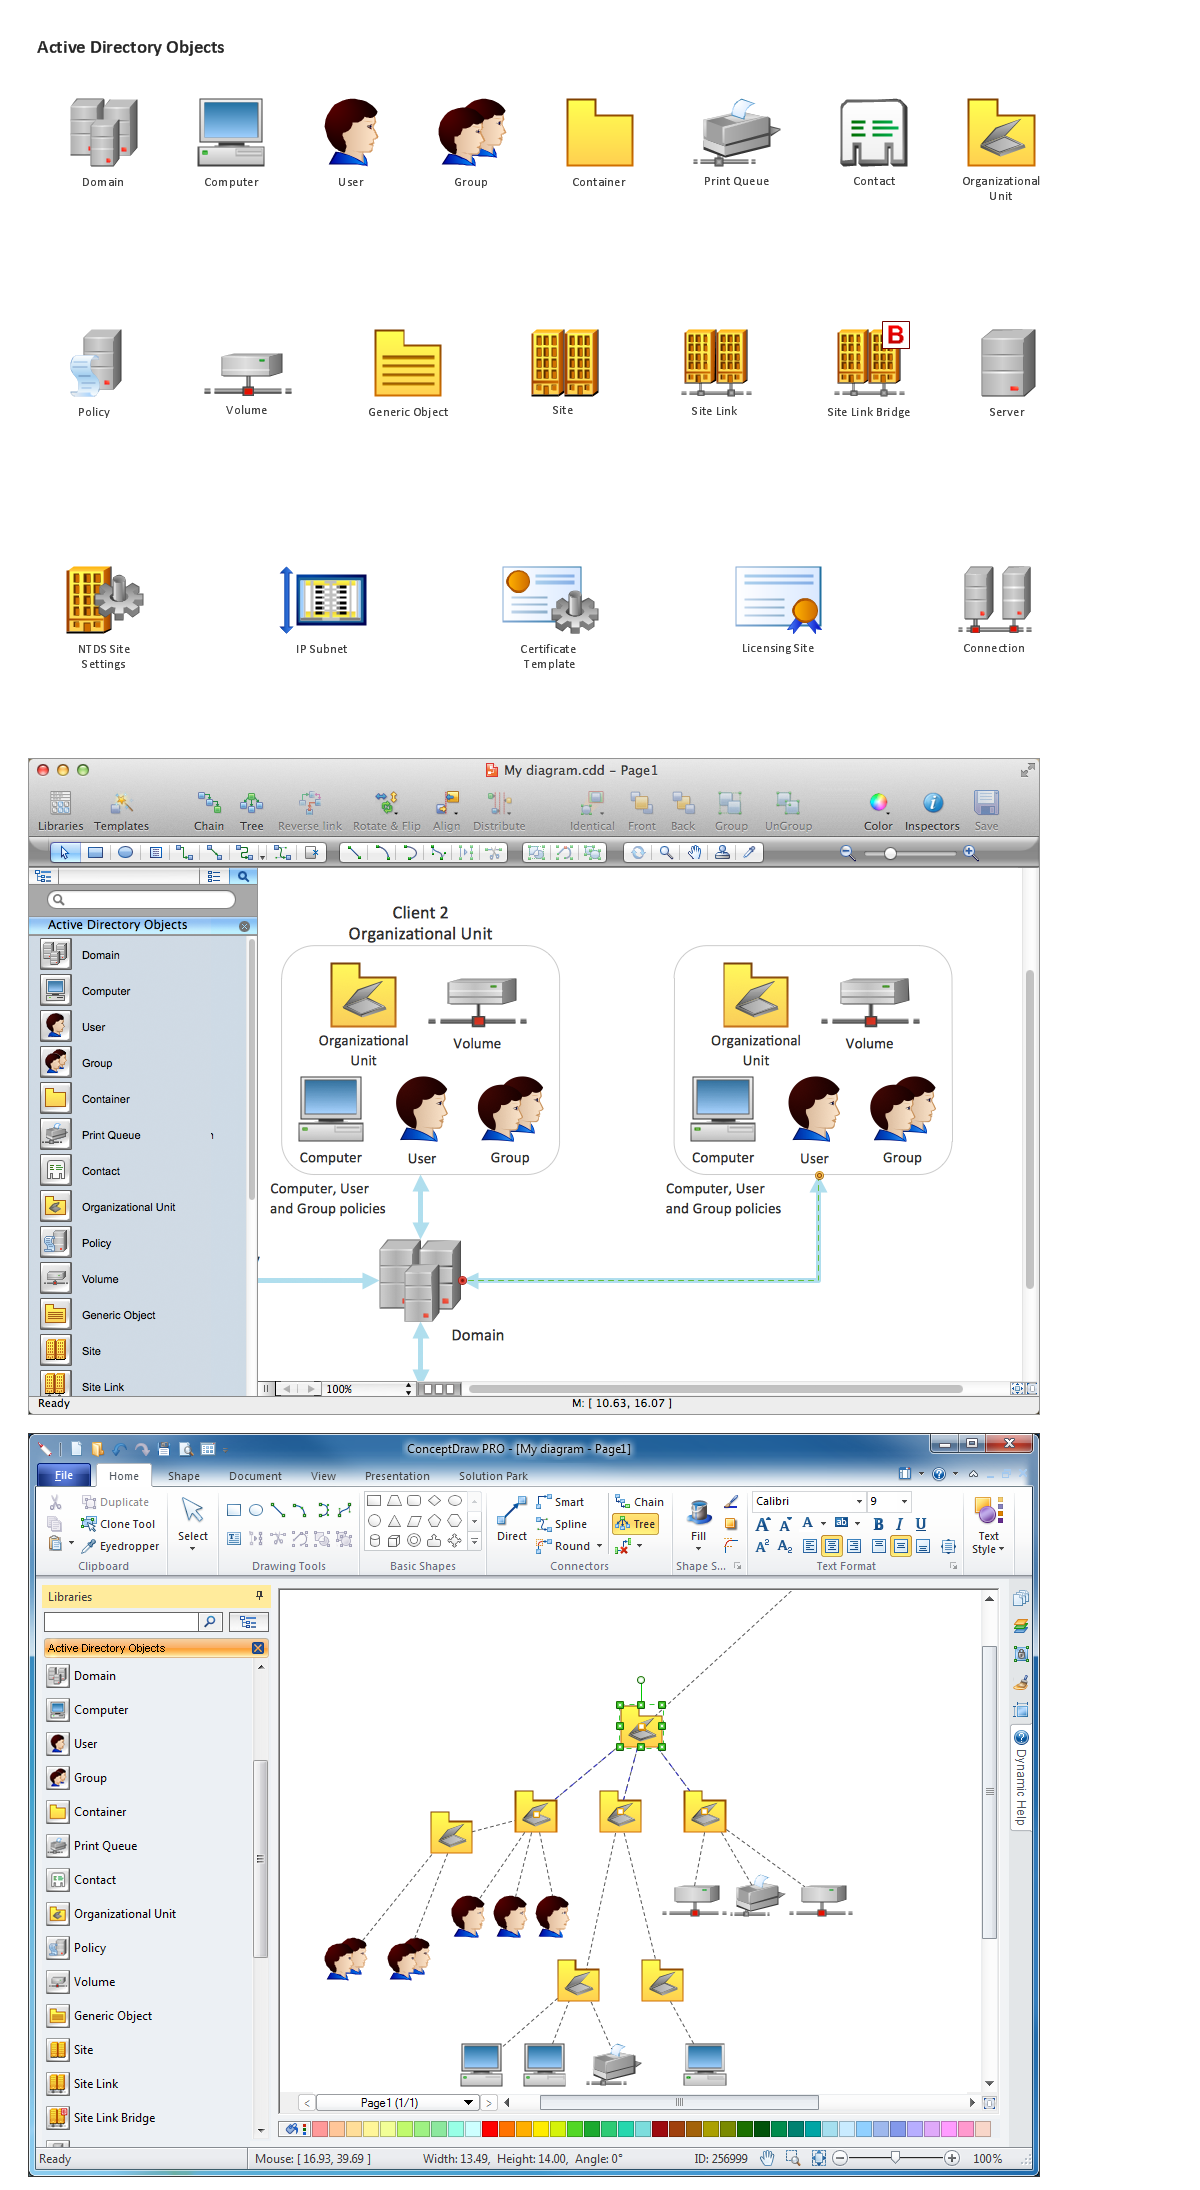
Network Diagramming Software for Network Active Directory Diagrams
ConceptDraw PRO is perfect for software designers and software developers who need to draw Network Active Directory Diagrams.
 Block Diagrams
Block diagrams solution extends ConceptDraw PRO software with templates, samples and libraries of vector stencils for drawing the block diagrams.
HelpDesk
How to Draw a Pyramid Diagram in ConceptDraw PRO
Pyramid diagram (triangle diagram) is used to represent data, which have hierarchy and basics. Due to the triangular form of diagram, each pyramid section has a different width. The width of the segment shows the level of its hierarchy. Typically, the top of the pyramid is the data that are more important than the base data. Pyramid scheme can be used to show proportional and hierarchical relationships between some logically related items, such as departments within an organization, or successive elements of any process. This type of diagram is often used in marketing to display hierarchical related data, but it can be used in a variety of situations. ConceptDraw PRO allows you to make a pyramid diagram, quickly and easily using special libraries.
 Directional Maps
Directional Maps solution extends ConceptDraw PRO software with templates, samples and libraries of vector stencils for drawing the directional, location, site, transit, road and route maps, plans and schemes.
HelpDesk
How to Draw a Histogram in ConceptDraw PRO
Histogram is a diagram used to visualize data through bars of variable heights. Making histogram can be helpful if you need to show data covering various periods (hours, days, weeks, etc). When the vertical column of the histogram refer to frequency it shows how many times any event happens. It is a Frequency histogram. A bar chart diagram is similar to a histogram, but in contrast to a bar chart a histogram represents the number how many times there have been certain data values. You can use a histogram to depict continual data flow such as temperature, time, etc. You can effortlessly draw histograms using the Histograms solution for CnceptDraw PRO. Making a histogram can by very useful to represent various statistical data.- How to Draw a Computer Network Diagrams | Computer Network ...
- Fundraising Pyramid | Free Online Street Map Draw
- 3d Network Chart Software
- 3D pictorial street map | Design elements - 3D directional maps ...
- Design elements - Vehicles 2D, 3D | Industrial vehicles - Vector ...
- 3D Network Diagram Software | Pyramid Diagram | Network ...
- UML interaction overview diagram - Online shopping | AWS ...
- Directional Maps | How to Create a Directional Map Using ...
- 3D pictorial road map | 2D Directional map - Template | Maps | Road ...
- Simple Diagramming | Process Flowchart | Simple Drawing ...
- ConceptDraw Solution Park | Enterprise Architecture Diagrams ...
- 3D Network Diagram Software | Basic Diagramming | How to Draw a ...
- Network Architecture | Mobile cloud architecture diagram | AWS ...
- Create Network Diagram Online Free
- 3D Network Diagram Software | Pyramid Diagram | 3D Network ...
- Road Transport - Design Elements | Bus Network Topology | | Bus ...
- Example of DFD for Online Store (Data Flow Diagram) DFD ...
- ConceptDraw Solution Park | Online Diagram Tool | Entity ...
- 3D Network Diagram Software | Maps | Design elements - 3D ...
- Pyramid diagram - Template | Pyramid Diagram and Pyramid Chart ...


