Made with
ConceptDraw
DIAGRAM 18

Value Stream Map Creator

Value Stream Mapping (VSM) is a tool used to visualize and structurize the key steps of the process. Having a simple and strict form, it provides a simple understanding of the process. Value Stream Map also facilitates making improvements to optimize a process, if required.

The advanced features of the ConceptDraw DIAGRAM Value Stream Map creator help to design your Value Stream Maps of any size in the shortest time. It's all due to the included Value Stream Mapping solution. It offers a set of standard Value stream mapping symbols to depict the workstreams, work activities, and information flows. The predesigned samples and template included in the Value Stream Mapping solution easier the design process. They give you the proper understanding of the diagrams of this type. The available template reduces your time and efforts to create a VSM. If you prefer to design your map from a blank sheet, you can also easily make this fast and effectively using the library's objects. And no prior experiences are required for you.

When your map is ready, it allows you to analyze the process steps. You can identify those that do not add value to the process and does not improve the product on the first passes through the process steps. Among these steps may fall testing, inspection, product movement, rework, or some others. Making changes in your map is also easy: just delete the step or change it on a different one. With ConceptDraw DIAGRAM you don't waste your time - all objects are already predesigned. You can simply take any objects from the library and drag to your map.

Better understand the flow of production and information, how the value-stream mapping analyzes information flow with Value Stream Maps. Identify areas for process improvement and collaborate seamlessly with your team in minutes with ConceptDraw DIAGRAM software and Value Stream Mapping Solution.

ConceptDraw DIAGRAM - Value Stream Map Creator

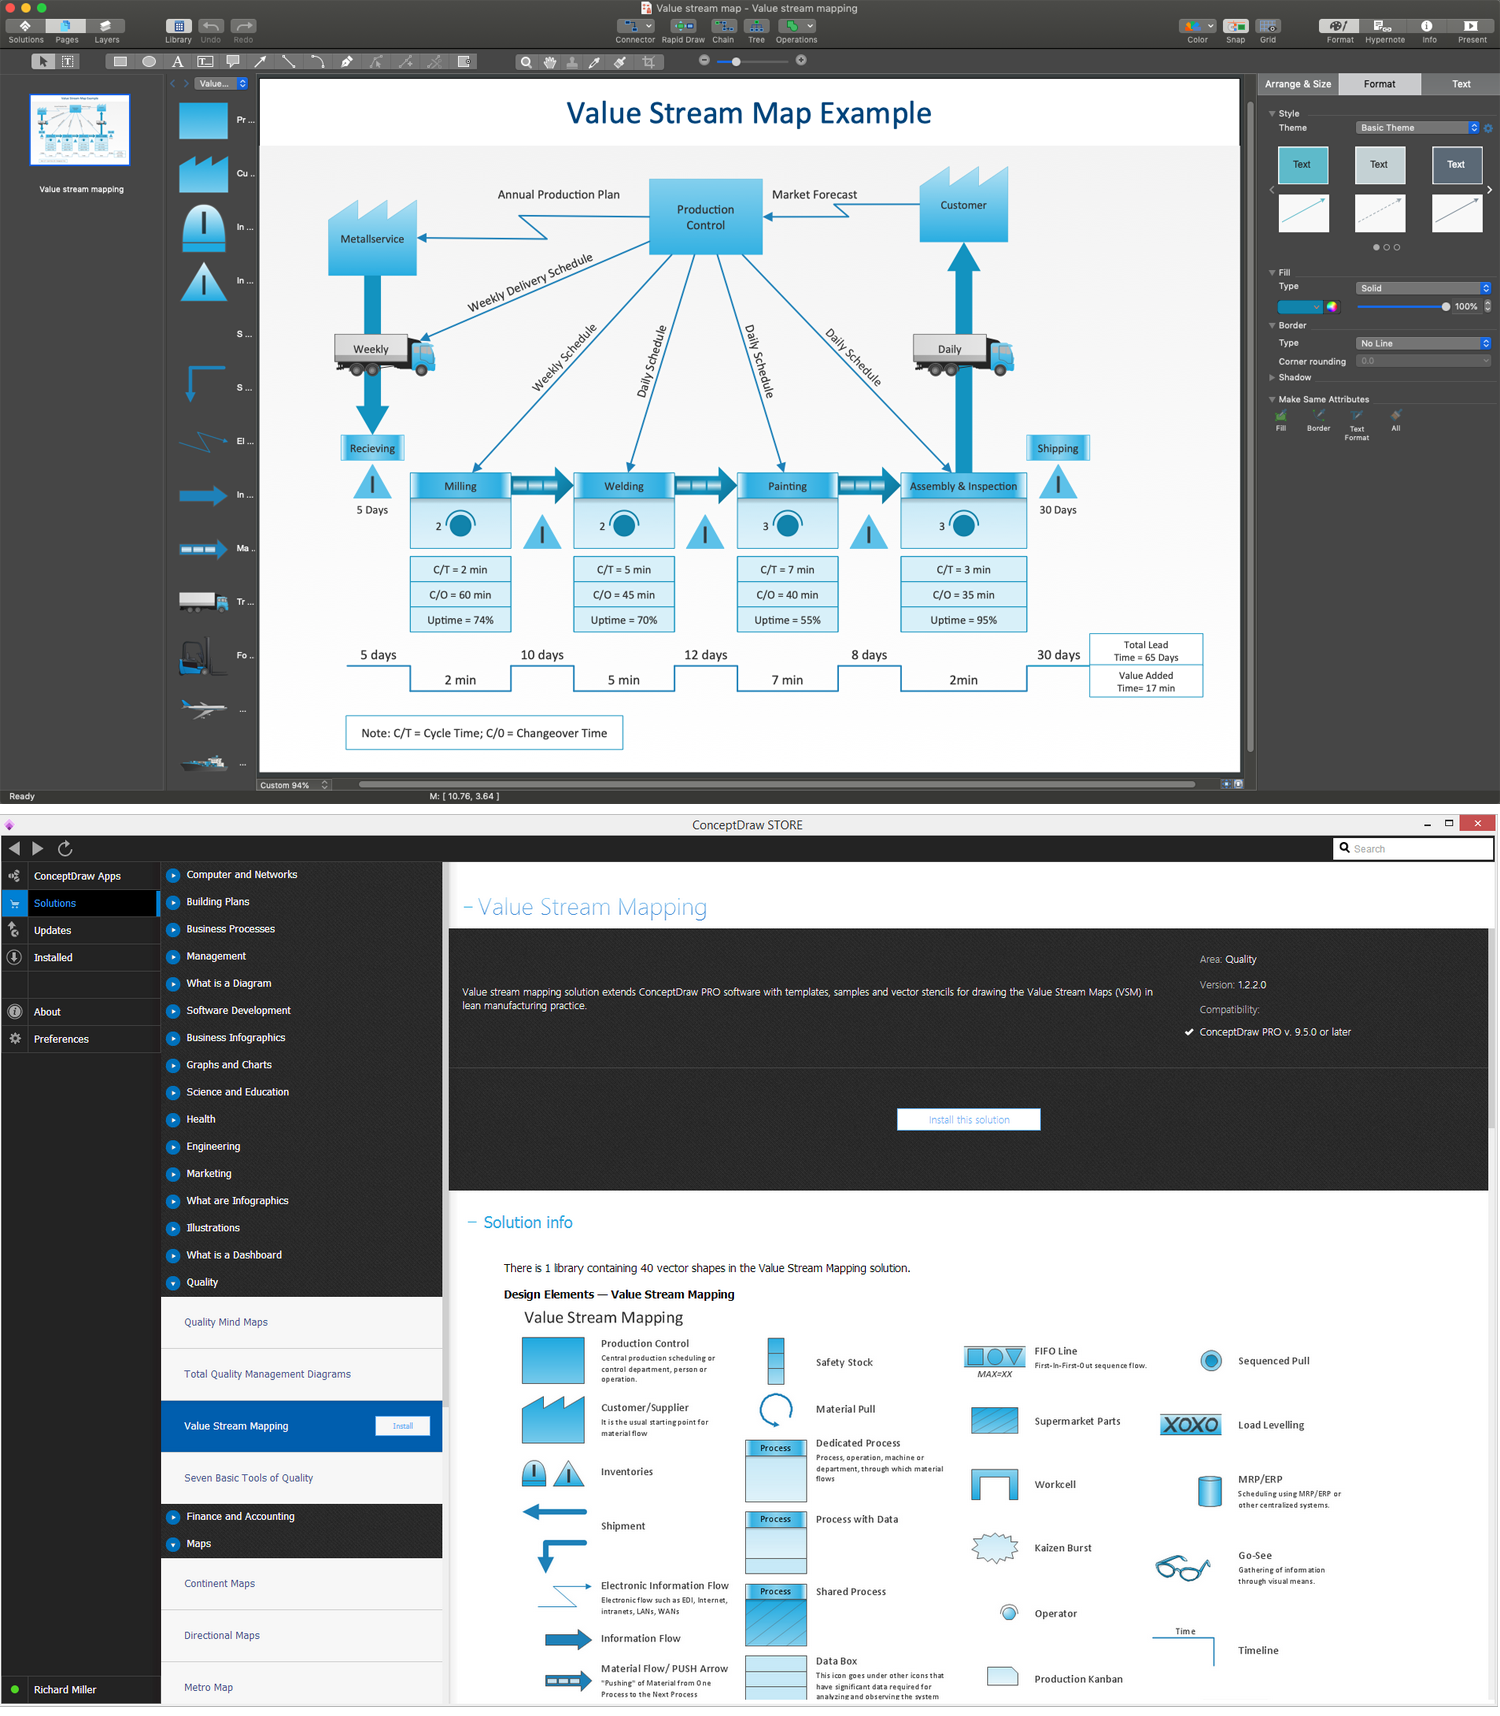
Example 1. ConceptDraw DIAGRAM - Value Stream Map Creator

The following features make ConceptDraw DIAGRAM the powerful Value Stream Map creator:

  1. You don't need to be an artist to draw professional-looking diagrams in a few minutes.
  2. Large quantity of ready-to-use vector objects makes your drawing diagrams quick and simple.
  3. Great number of predesigned templates and samples give you a good start for your own diagrams.
  4. ConceptDraw DIAGRAM provides you the possibility to use the grid, rules, and guides. You can easily rotate, group, align, arrange the objects, use different fonts and colors to make your diagram exceptionally looking.
  5. All ConceptDraw DIAGRAM documents are vector graphic files and are available for reviewing, modifying, and converting to a variety of formats: image, HTML, PDF file, MS PowerPoint Presentation, Adobe Flash, MS Visio.
  6. Using ConceptDraw STORE you can navigate through ConceptDraw Solution Park, managing downloads and updates. You can access libraries, templates, and samples directly from the ConceptDraw STORE.
  7. If you have any questions, our free of charge support is always ready to come to your aid.


THREE RELATED HOW TO's:
When trying to figure out the nature of the problems occurring within a project, there are many ways to develop such understanding. One of the most common ways to document processes for further improvement is to draw a process flowchart, which depicts the activities of the process arranged in sequential order — this is business process management. ConceptDraw DIAGRAM is business process mapping software with impressive range of productivity features for business process management and classic project management. This business process management software is helpful for many purposes from different payment processes, or manufacturing processes to chemical processes. Business process mapping flowcharts helps clarify the actual workflow of different people engaged in the same process. This samples were made with ConceptDraw DIAGRAM — business process mapping software for flowcharting and used as classic visio alternative because its briefly named "visio for mac" and for windows, this sort of software named the business process management tools. This flowchart diagram shows a process flow of project management. The diagram that is presented here depicts the project life cycle that is basic for the most of project management methods. Breaking a project into phases allows to track it in the proper manner. Through separation on phases, the total workflow of a project is divided into some foreseeable components, thus making it easier to follow the project status. A project life cycle commonly includes: initiation, definition, design, development and implementation phases. Distinguished method to show parallel and interdependent processes, as well as project life cycle relationships. A flowchart diagram is often used as visual guide to project. For instance, it used by marketing project management software for visualizing stages of marketing activities or as project management workflow tools. Created with ConceptDraw DIAGRAM — business process mapping software which is flowcharting visio alternative or shortly its visio for mac, this sort of software platform often named the business process management tools.Process Flowchart
Picture: Process Flowchart: A Step-by-Step Comprehensive Guide
Related Solution:
Follow samples and map templates to create nfographic maps. It's super-easy!Map Infographic Creator *
Picture: Map Infographic Creator
Flowcharts are the type of charts used to depict the processes or their certain aspects. Cross-functional flowchart reflects also people, teams, organizational units, or some other categories responsible for each process stage. ConceptDraw DIAGRAM software extended with the Flowcharts solution from the Diagrams area of ConceptDraw Solution Park is an easy Flowchart creator. It is efficiently used for making the Flowcharts, Cross-functional flowcharts, diagrams and charts of any size and complexity, and also allows simultaneous drawing Flowcharts on the different pages and connecting them with each other.Easy Flowchart Creator - ConceptDraw DIAGRAM
Picture: Easy Flowchart Creator
Related Solution:
ConceptDraw
DIAGRAM 18