Steel Presentation
Business ProductivityIn Business Productivity Solutions we support managers and knowledge workers in making their jobs easier, saving them time and achieving better results. The solutions in the ConceptDraw Solution Park extend our ConceptDraw products beyond the scope of what ships with the product and add value to all of our products going forward. If in your job you need to make presentations, conduct meetings, prepare documents, brainstorm and build new strategies; as well as save yourself time then ConceptDraw Solution Park will provide you with the tools you need to be successful. You will find that our solutions are well designed to save you valuable time when you only have a minute or two to prepare. By leveraging content that has already been authored and then rapidly repurposing it to meet your requirements you have ratcheted up your ability to respond to any eventuality. Even a critical presentation that you only have a moment to prepare can be professionally generated and presented. No other tool anywhere gives you the flexibility and the immediacy that you will find in ConceptDraw Office and ConceptDraw Solution Park. When you do professional work and need more integrated approach for your data processing using many various software tools – then you need check Solution Park for separate support your professional Activity. It delivers comprehensive support for professional activities as separate Solution Park’s Activity collection of integrated software tools and the number of supported activities is growing. To achieve the professional results you desire, while being able to respond faster than you have ever been able to before require an integrated approach that leverages the data and documentation that currently exists. ConceptDraw Office in combination with the extensibility provided by ConceptDraw Solution Park supports your business activities. ConceptDraw Solution Park is an ever growing collection of point solutions that adds value to your investment. QualityBenefitsQuality Management Diagrams (Total Quality Management Diagrams, Timelines, Workflows, Value Stream Maps) and Mind Maps (Presentations, Meeting Agendas, Problem to be solved). ObjectiveVisually document and communicate quality management information. Solution PurposeQuality management diagrams and mind maps are effective and easy to use. Intended ForIndividuals involved in product/service quality planning, control, assurance and improvement using visual documenting and communication. Products and MethodsTo support you in your tasks you can use the power of ConceptDraw DIAGRAM providing intelligent vector graphics that are useful for Quality Solution diagramming and ConceptDraw MINDMAP for key Quality Solution mind maps. Steel PresentationPresentation with Steel style in ConceptDraw DIAGRAM with illustrations and notes from mind map document.
|
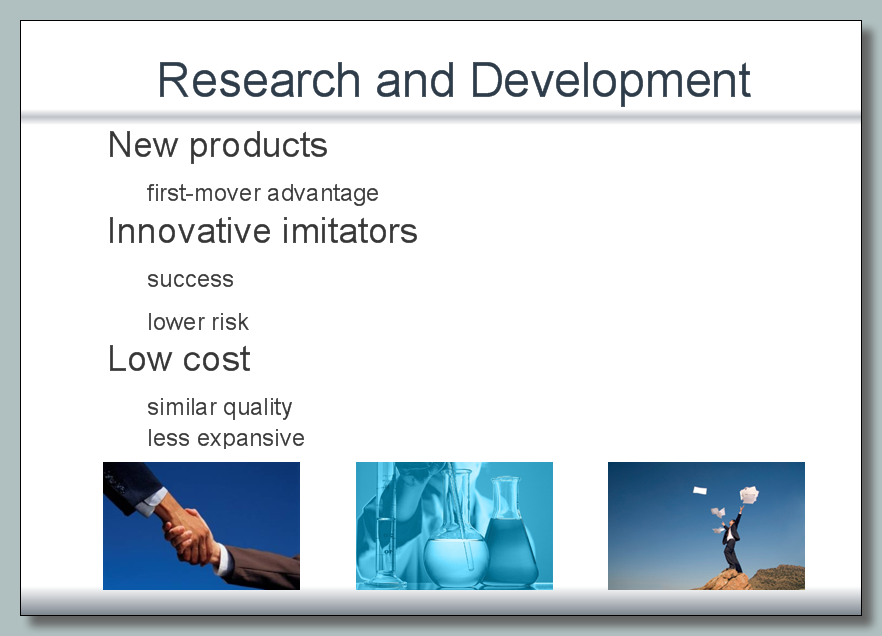
Example 1. Steel Presentation
The Benefits for ConceptDraw MINDMAP Brainstorming Software
- ConceptDraw MINDMAP is effective for brainstorming, designing mind maps, idea generating, creative and lateral thinking, creativity and problem solving.
- ConceptDraw MINDMAP is ideal for team and personal work in Business, Marketing and Project Management.
- The libraries with large quantity of vector objects help to illustrate your mind maps and to make them bright, visual and comprehensible.
- Use of View Navigator tool lets create presentations from a mind map: you can simply select the map parts you want to present, sequence your slides, and preview the presentation.
- ConceptDraw MINDMAP provides wide capabilities of importing and exporting in various formats: Microsoft PowerPoint, Microsoft Word, MS Excel, Mindjet MindManager, image, HTML, PDF file.