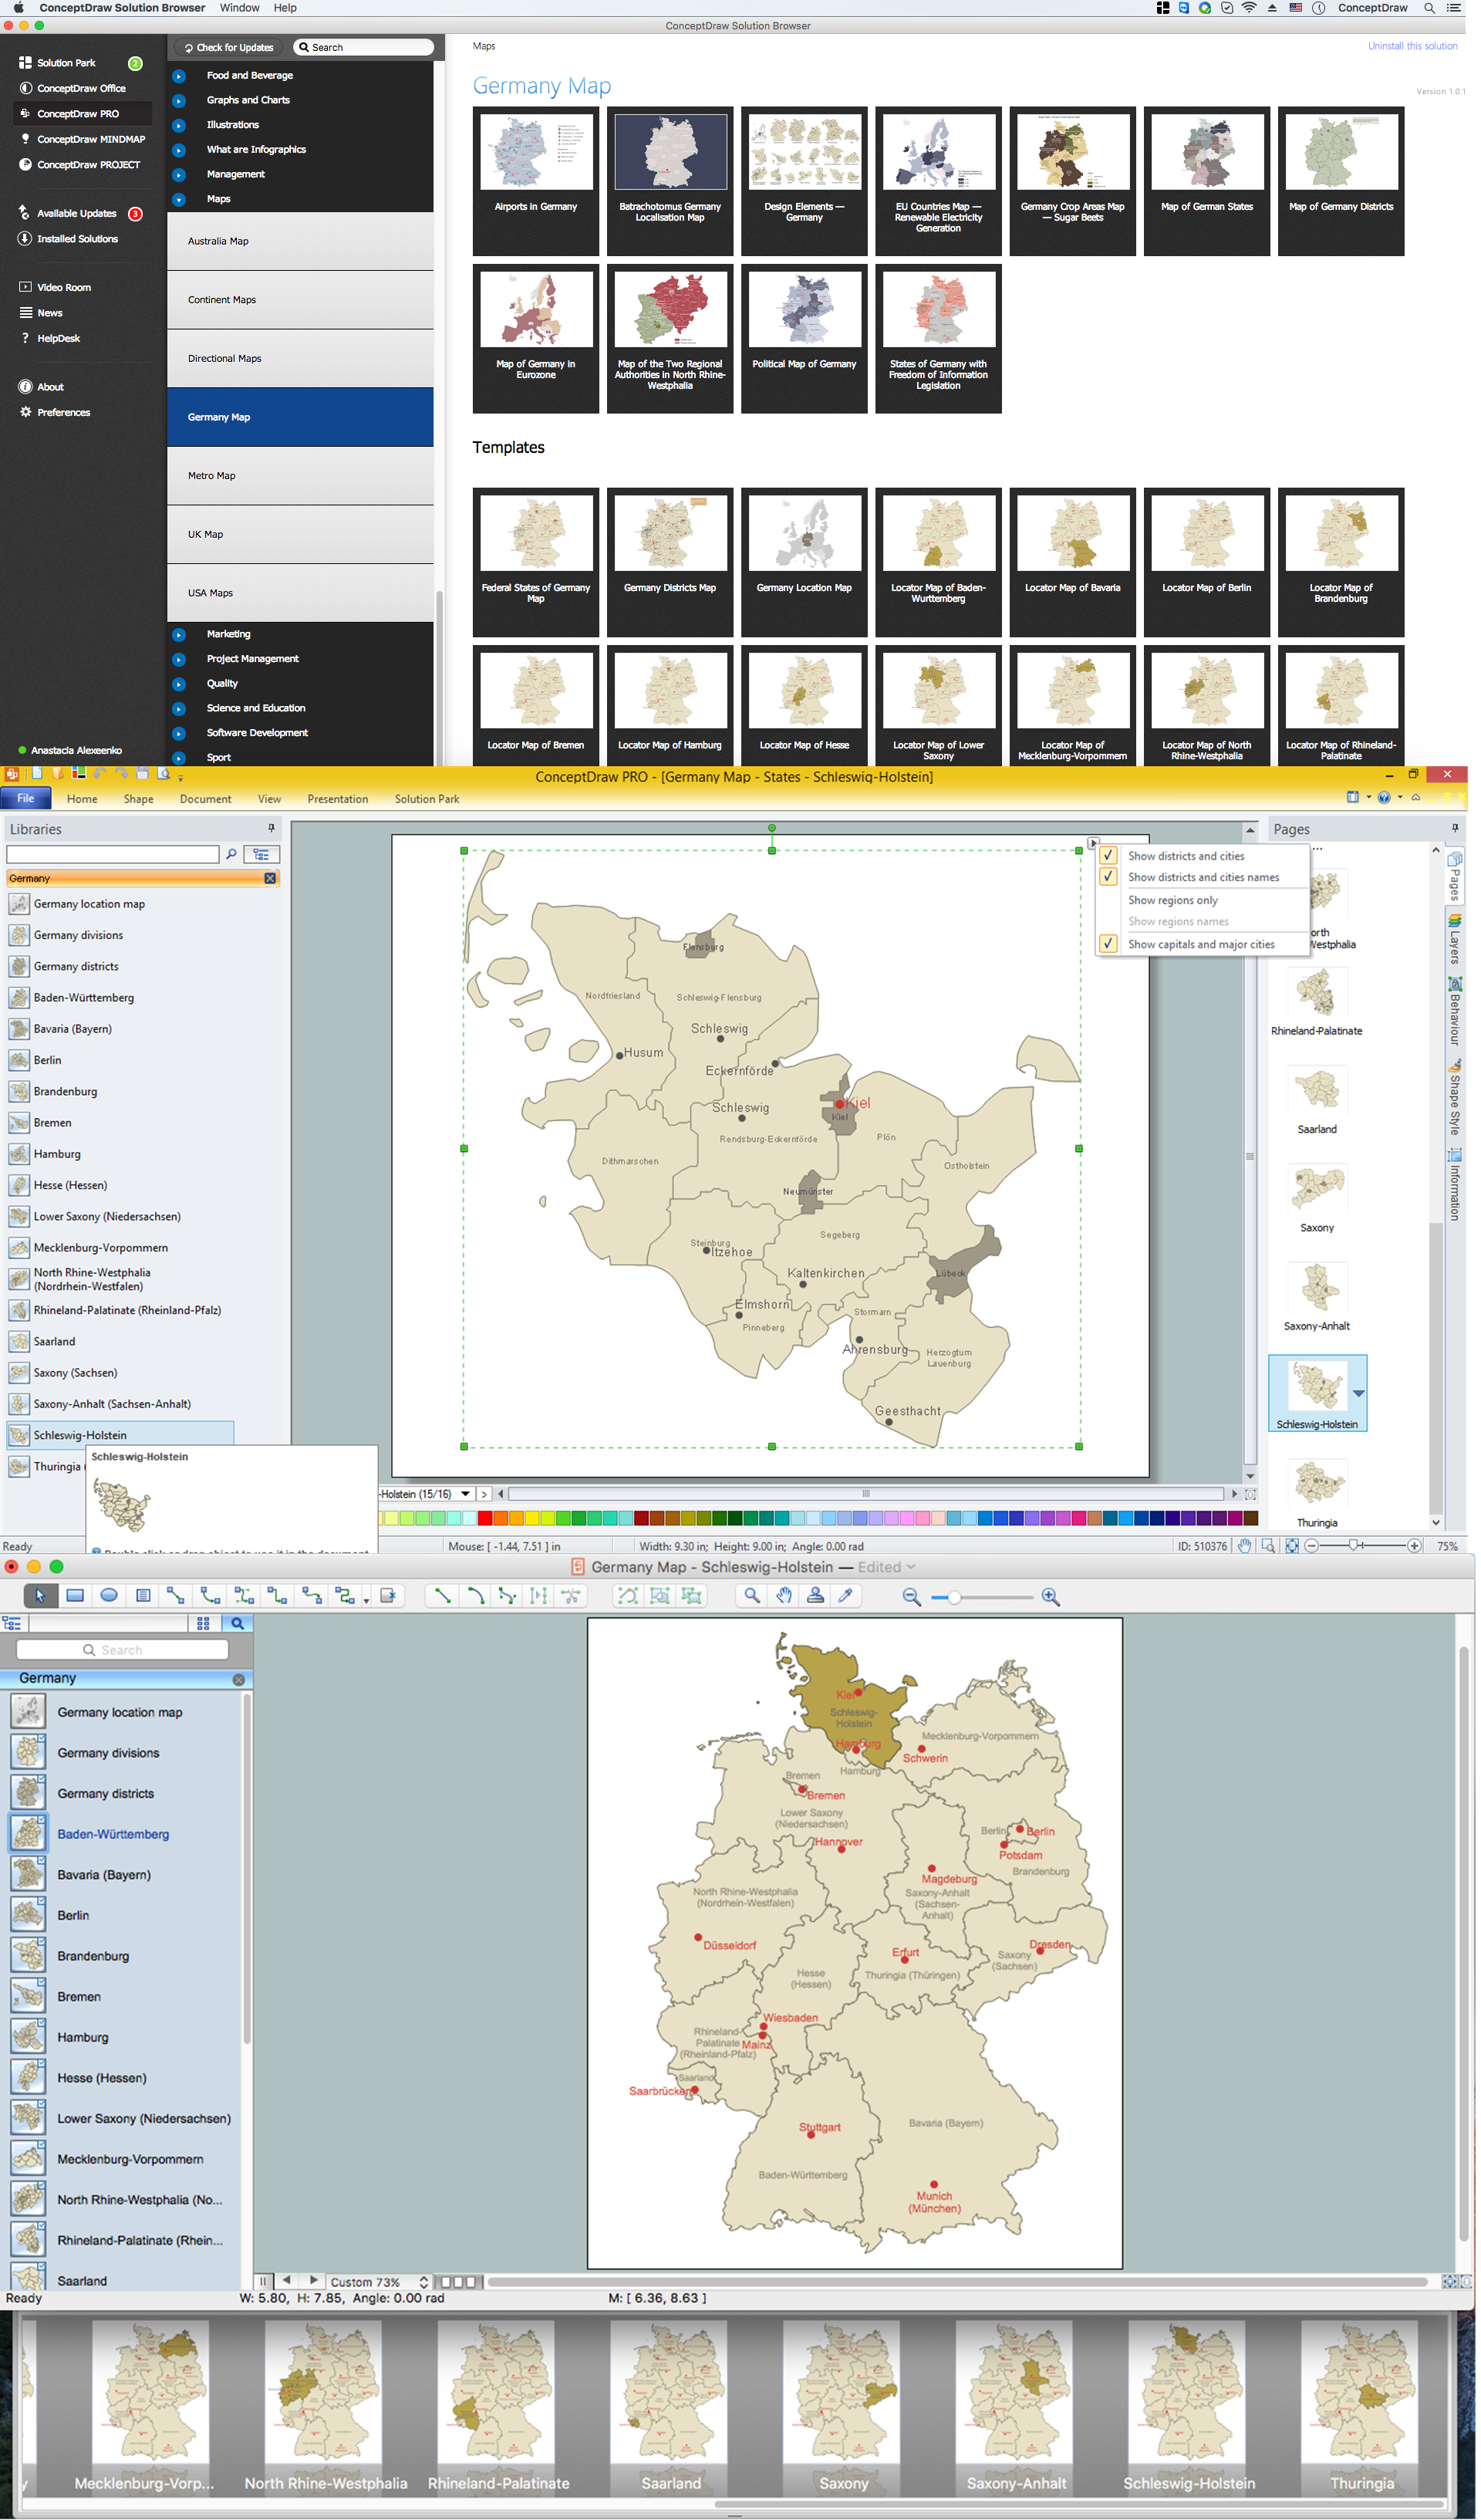
Example 1. Germany Map Solution — Schleswig-Holstein State (Mac OS X, Windows)
Use of ready objects is a fastest way of drawing vivid and attractive maps and cartograms, and Germany maps are not exception. The Germany Map Solution offers for ConceptDraw DIAGRAM users wide variety of ready-to-use vector map objects, which compose the Germany library.
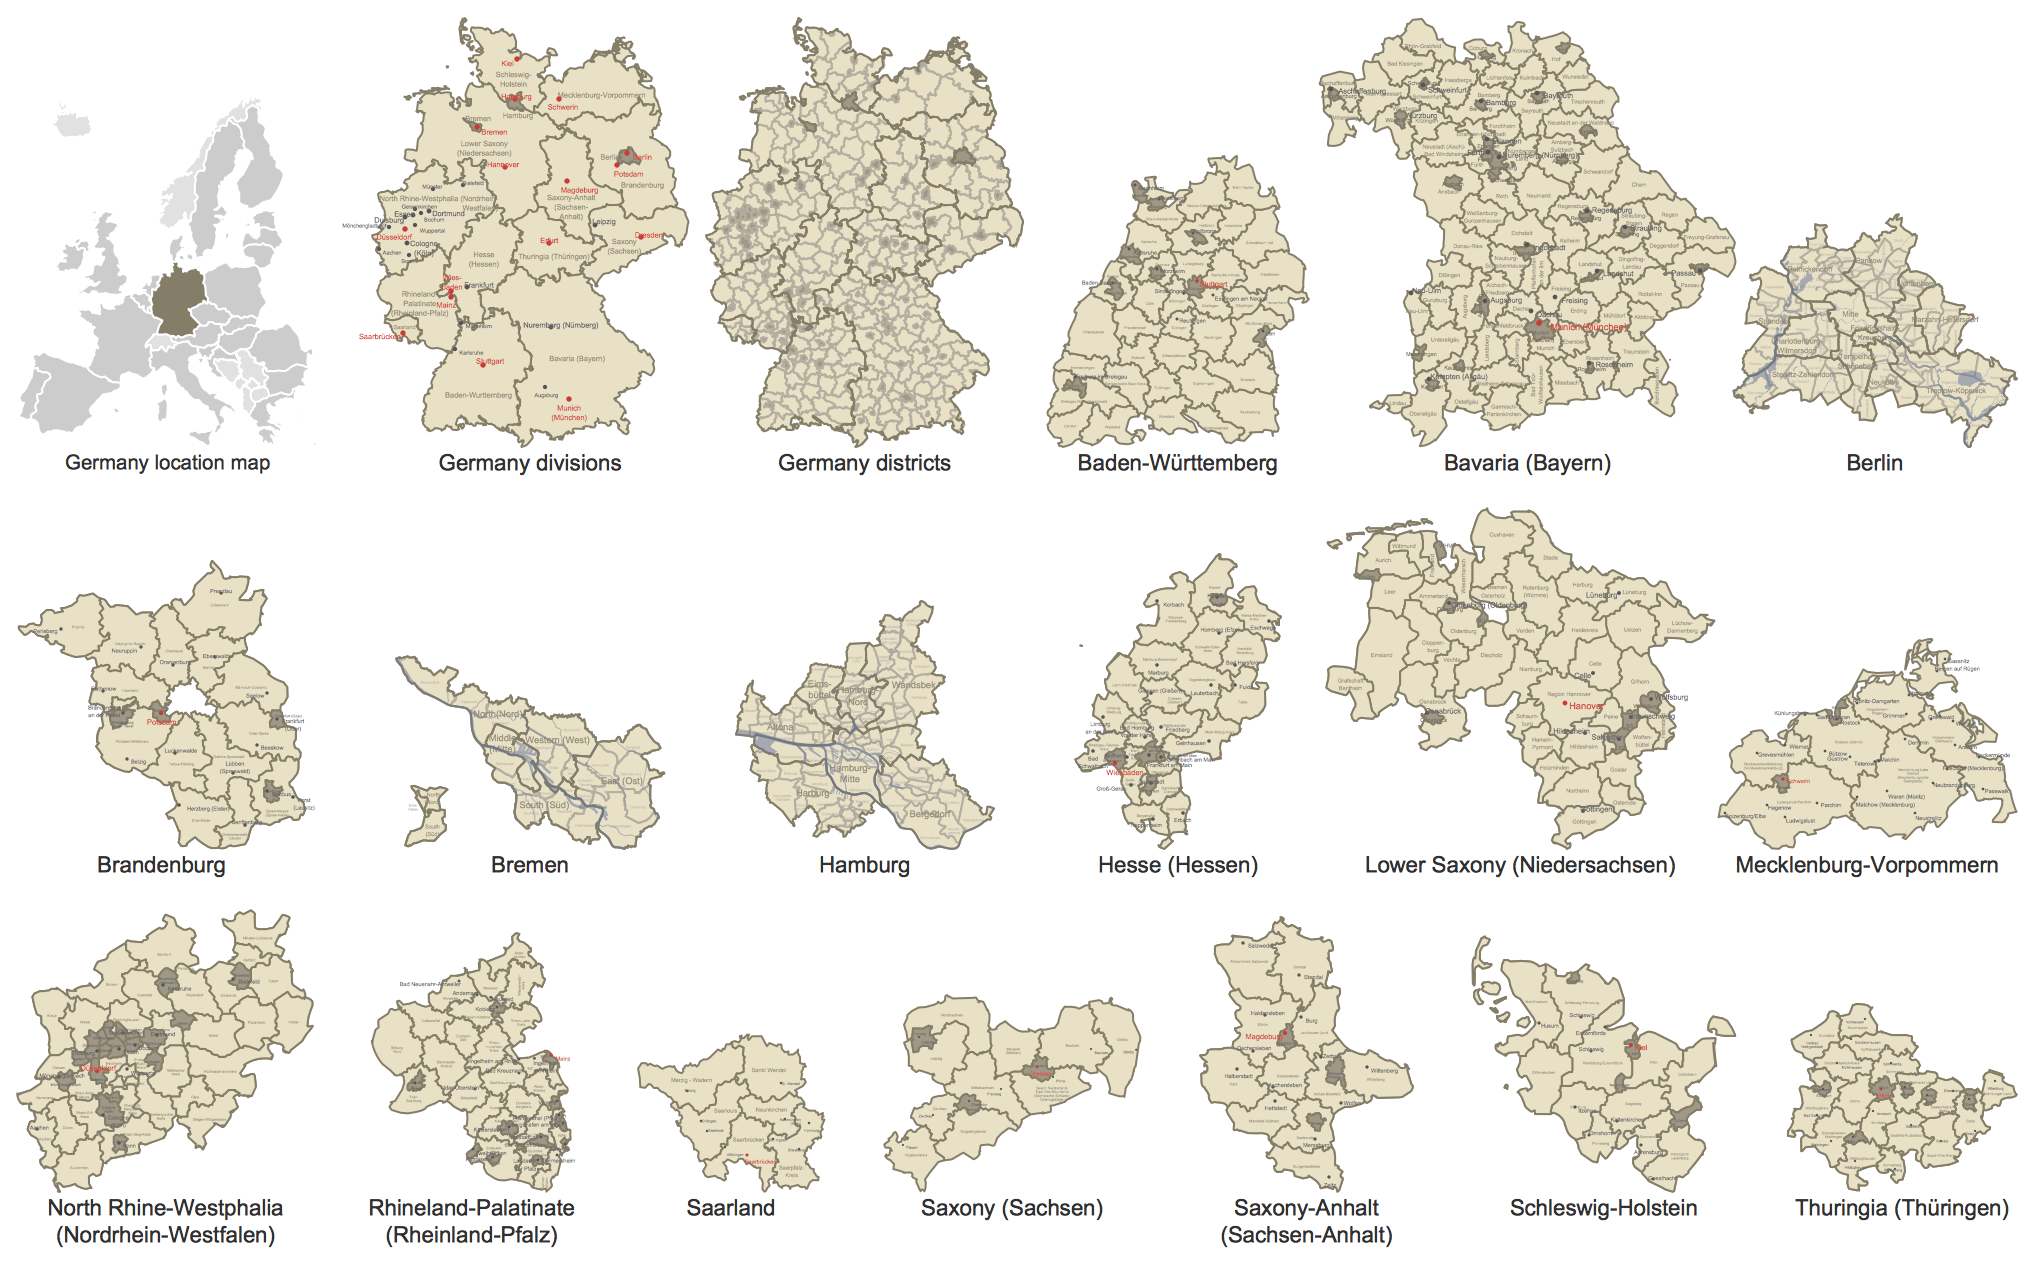
Example 2. Germany Library Design Elements
These objects allow easy design many kinds of Germany maps, among them geographic, topography, political map of Germany, detailed map of Germany with cities, various thematic Germany maps that are used for visually illustration important information and statistical data, and many other useful maps.
All source documents are vector graphic documents. They are available for reviewing, modifying, or converting to a variety of formats (PDF file, MS PowerPoint, MS Visio, and many other graphic formats) from the ConceptDraw STORE. The Germany Map Solution is available for all ConceptDraw DIAGRAM users.
THREE RELATED HOW TO's:
The Channel Islands are an archipelago in the English Channel, off the French coast of Normandy.
How to design the Map of UK fast and easy? It is incredibly convenient to use special software. ConceptDraw DIAGRAM diagramming and vector drawing software offers the Map of UK Solution from the Maps Area of ConceptDraw Solution Park specially developed to make easier drawing the maps of UK counties, various UK related thematic maps and cartograms on their base.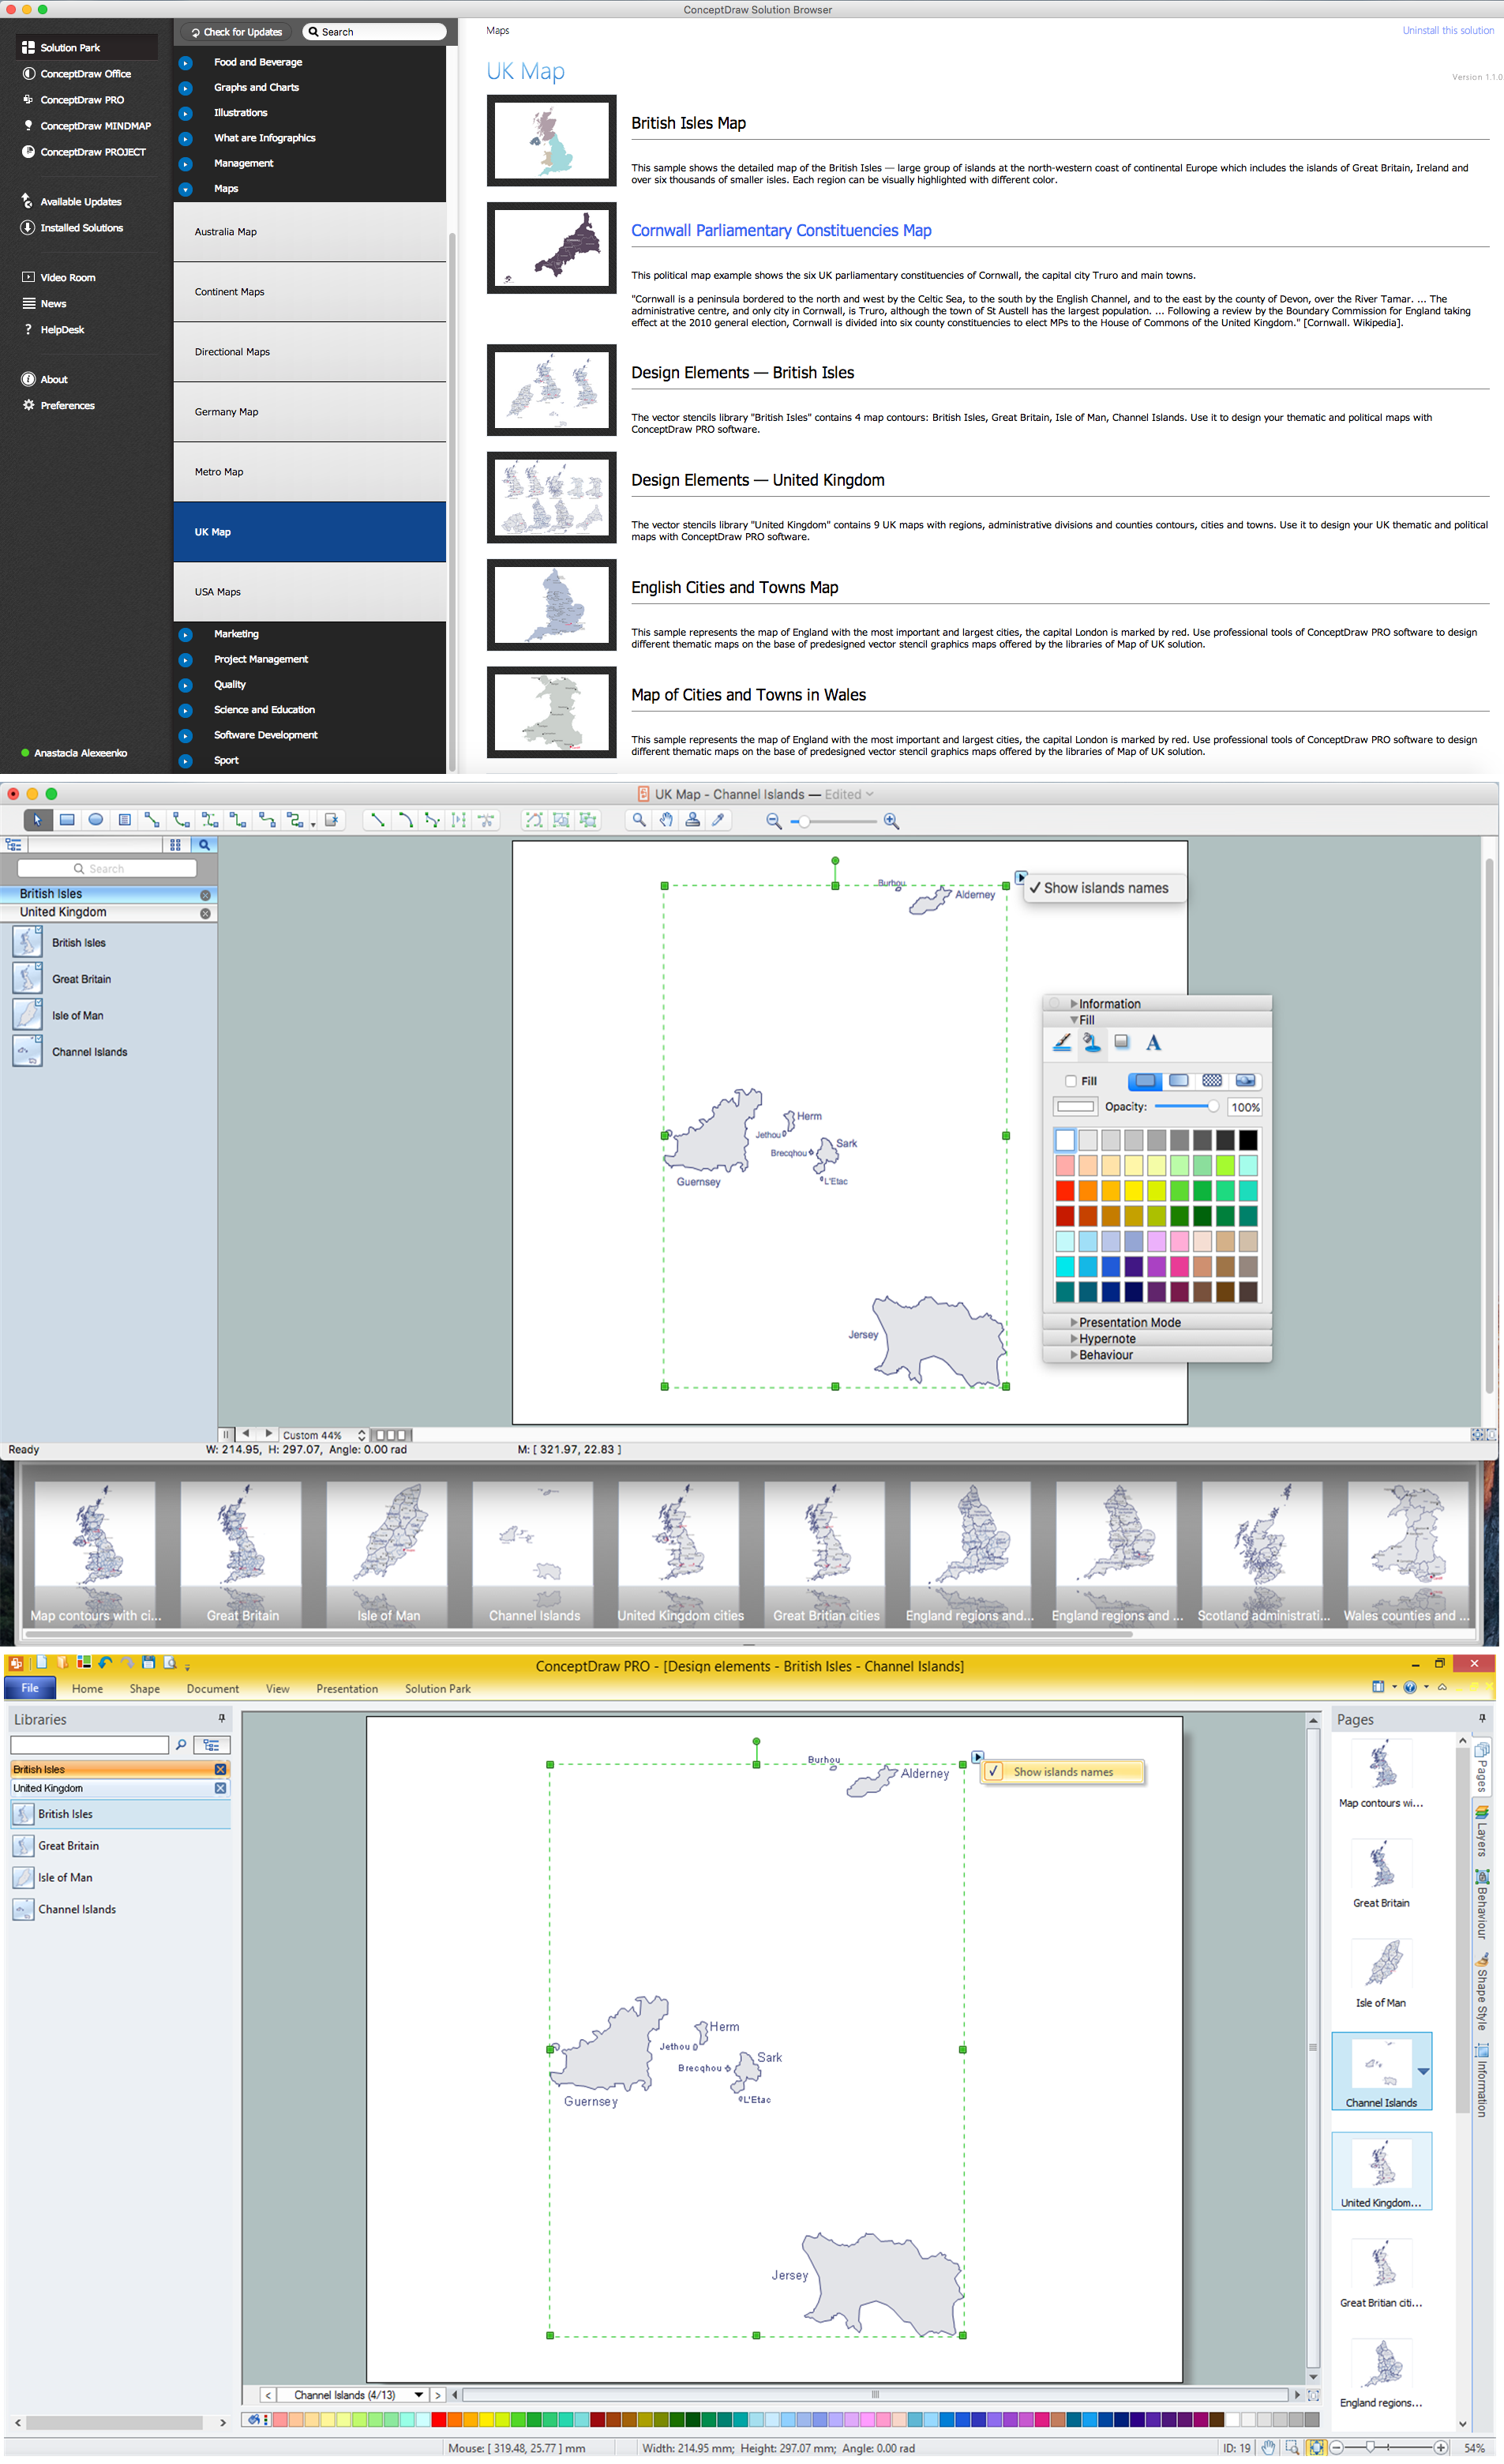
Picture: Map of UK — Channel Islands
Related Solution:
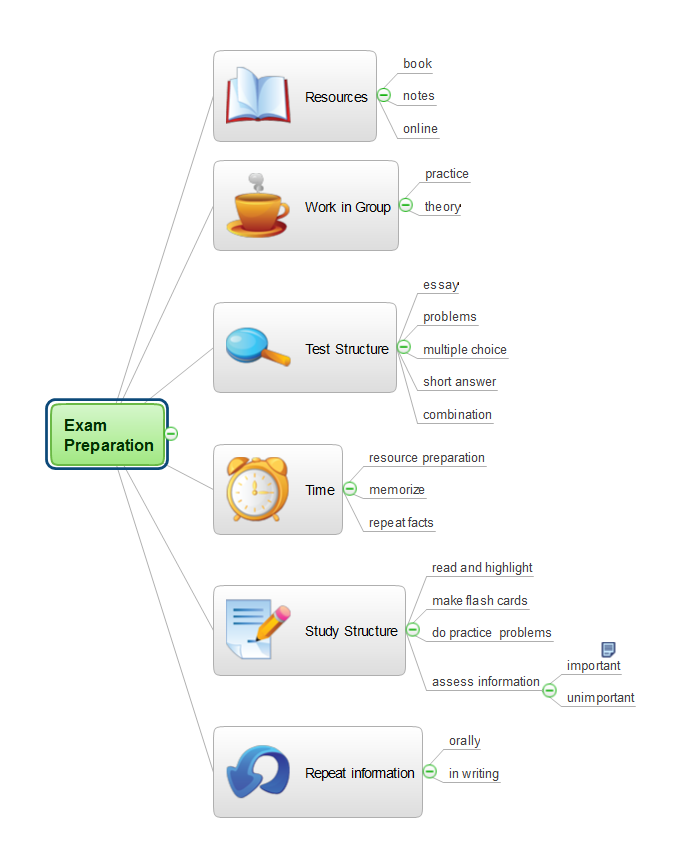
Picture: Exam Preparation Mind Map
Related Solution:
There are many tools to manage a process or to illustrate an algorithm or a workflow. Flowcharting is one of those tools. However, it may be difficult to show complex processes that require multiple attributes or several people in a simple flowchart, so a cross-functional flowchart would be a solution for that situation. To create such flowchart, group processes and steps to labeled rows or columns, and divide those groups with horizontal or vertical parallel lines. It is worth mentioning that there are different types of cross-functional flowcharts, like opportunity or deployment flowchart.
This diagram shows a cross-functional flowchart that was made for a trading process. It contains 14 processes, distributed through 5 lines depicting the participants who interact with the process. Also there are connectors that show the data flow of information between processes. The cross-functional flowchart displays a detailed model of the trading process, as well as all participants in the process and how they interact with each other. The lines in the flowchart indicates the position, department and role of the trading process participants.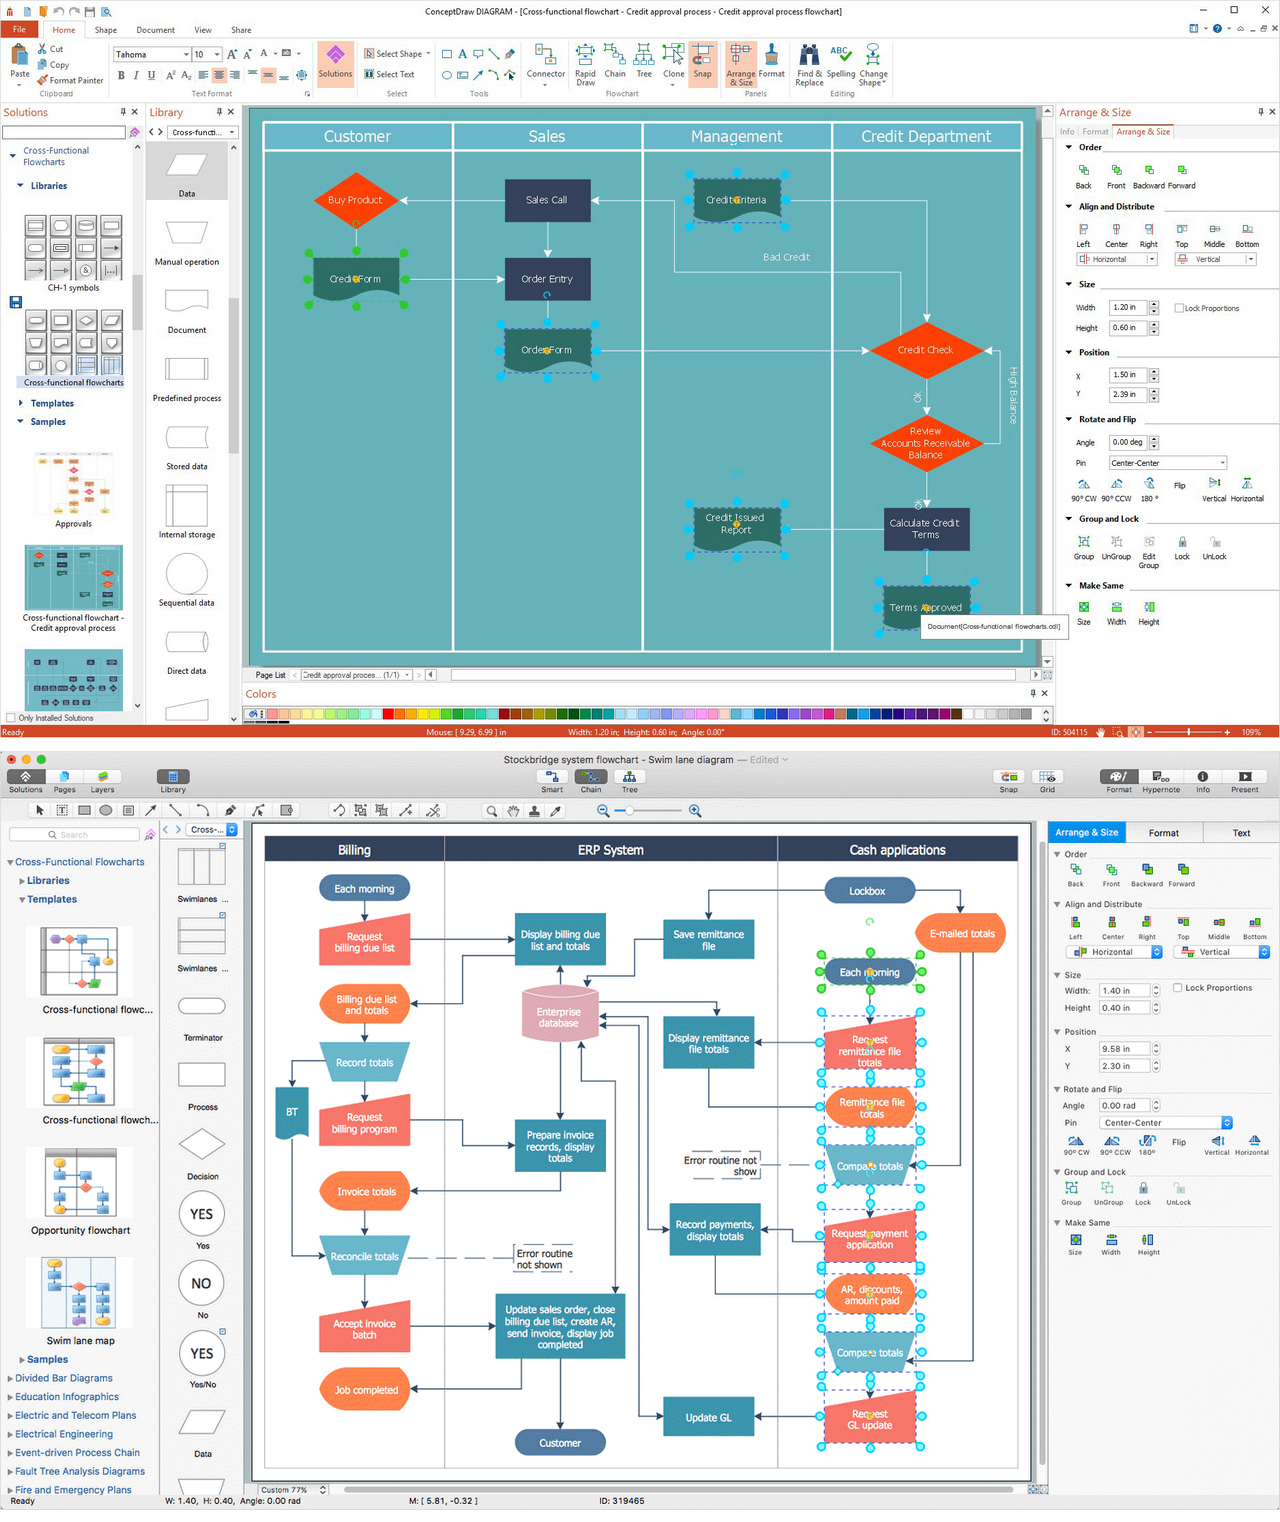
Picture: Cross-Functional Flowchart
Related Solution:
