Family Tree Drawing Tool
A Family tree is a diagram visually representing a person’s lineage and allows one to trace genealogy, and relationships of ancestors and descendants in a given family using a tree structure. It shows a hierarchical data structure, where the older generations are mostly organized at the top and the youngest or current generations at the bottom. The family members of the same generation (brothers and sisters) are placed on the same level. Any glance at the family tree can tell a lot, even more than documents or tables. It is also a way to find out how your family story relates to well-known historical events.
Family trees take their origin many centuries ago. However, the exact origin of the family trees is difficult to identify. People have been documenting their heritage for a long time and in different points of the world. Earlier and now family trees are a perfect way to discover more about your family, feel a connection to your family, establish the roots of identity, and capture your family history for descendants. In addition, the genealogical type of a family tree often plays a key part in medical and anthropological studies. A number of health-related issues are hereditary. The family tree is helpful in identifying genetic traits in the family, diagnosing issues early, and treating them correctly. It helps to trace the genetics of your family in a visual form. Family trees are also helpful in tracing your origin. Sometimes it is convenient in law issues, legal disputes, and other judicial. They can help to resolve hereditary issues, settle questions of land or property ownership, legal entitlement to it by proving that your ancestors are historical owners of this land or property.
Creating a family tree is an accurate and careful process. In most family trees a specific person is placed in a center. The parents, grandparents, siblings, children, and more distant relatives form branches around the center and resemble the natural growth pattern of a tree. Each family member plays a significant role in the family’s history. The family tree can have a regular structure when all ancestors from both maternal and paternal lines are known, or unregular when some data are missing. However, any kind of family tree, regular or unregular, is valuable for a certain person. Because it is a visual way to trace direct lineage with descendants and explore how closely he is related to other family members.
The way to construct the family trees differs and greatly depends on your preferences - from the bottom up, from the top down, horizontally from left to right, or from the middle to both sides. One differs the ancestor and descendent trees. The ancestor tree starts with one person and shows all his ancestors, parents, grandparents, and older generations. The descendant tree illustrates the descendants of a person, children, grandchildren, and other living relatives, siblings, cousins, etc. The combinations of both types are also common.
Family trees can be simple and include only close family members, or complex allowing you to trace many generations back and explore who your ancestors are and from where they are. As a rule, the family trees include up to four or five generations, because of the limited information. It is really hard to find accurate records older than a few hundred years if they were not collected specially before and stored reliably. Wars, fires, floods, and simple carelessness are the main reasons for missing documents. However, the families of famous historical figures and royal families are the exception, often their lineage is precisely known and documented for many centuries.
It is only your own choice what generation you want to start with and in what direction you want to move. You can start from you and build your tree backward, from the bottom up, showing ancestors from generation to generation to most elder, or build downwards starting with older generations to you. In any case, start with research and collecting information, conduct a small genealogical research on your family, use the photos, papers, documents, reliable records, and other materials proving your history, talk with relatives to fill in the gaps. All information, even small details can become valuable. The amount of collected information impacts the size and level of detalization of the future family tree. Decide also what amount of data you will include for each family member, only minimal like name and year of birth, or more detailed including maiden name, entire date and place of birth, role in the family, profession, etc.
Example 1. Family Tree Drawing Tool - ConceptDraw's Family Tree Solution
Organizing the collected data in a graphical family tree helps to make their understanding and interpretation easier. Show the family members with shapes as leaves on a tree, add more boxes until all your family members have been included. Add information to each leaf and connect shapes with lines to represent relationships. As a rule, the boxes or ovals are used for a family tree, but you can also use any shape you desire. Arrange the family members in a diagram, indicate the birth dates, marriage dates, and depict relationships between spouses, parents, and children. Place a single generation on each tree level to ensure easy tracing relationships.
To make your family tree useful for all other family members, it is recommended to focus on its clearness and simplicity and include only the most important key information. In this way, the information is easily percept and digested. All additional information you can save in files and use on the request. The passage of time is also often included in a diagram.

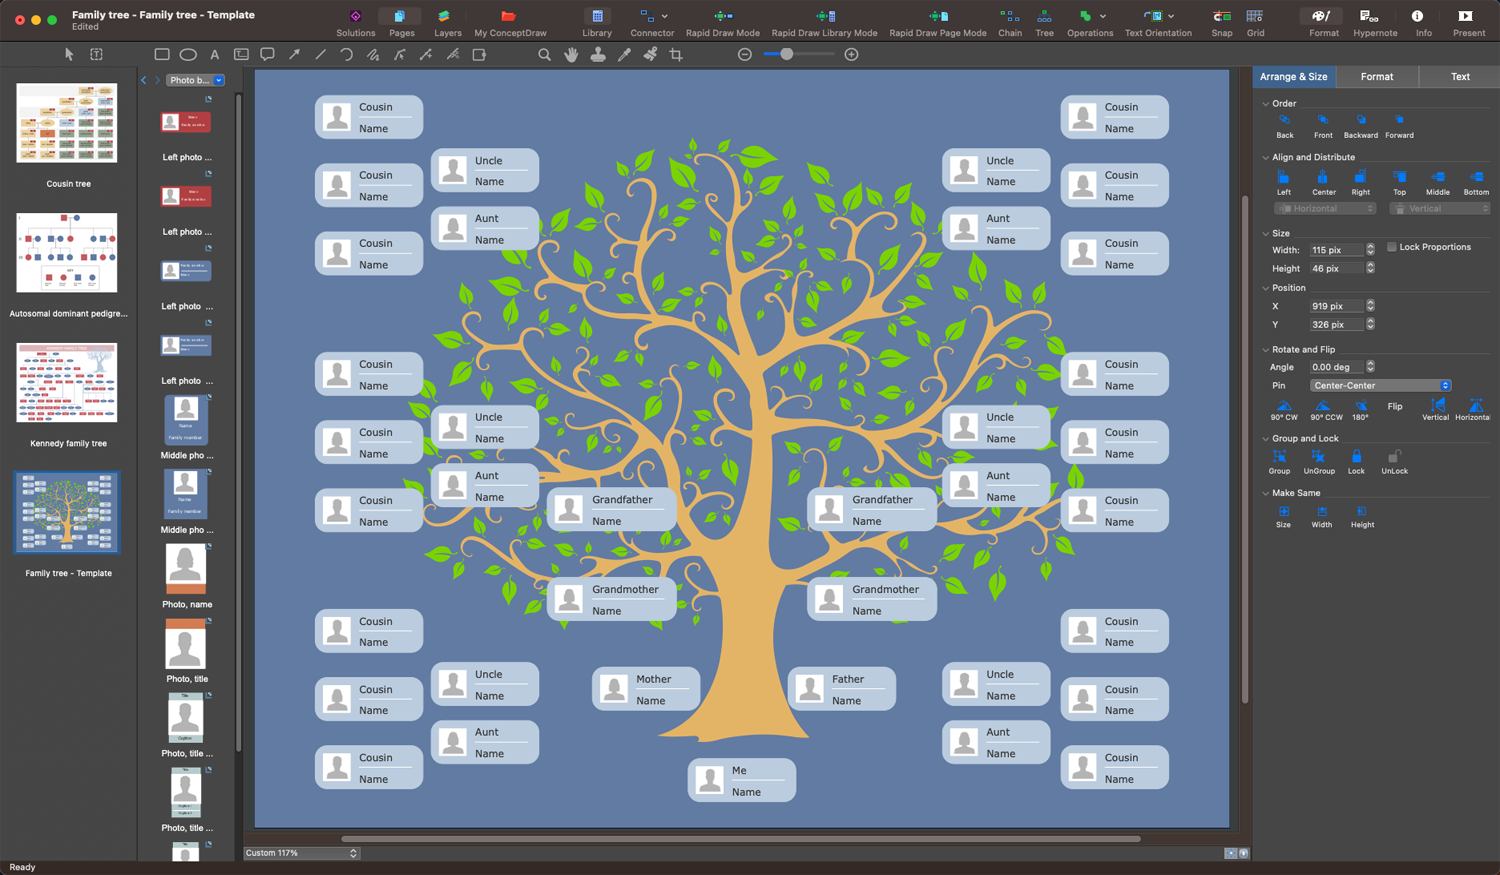
Example 2. Family Tree Solution Libraries Design Elements
Drawing a Family tree with professional vector drawing software is much more convenient than freehand drawing on paper. An intuitive family tree drawing tool Family Tree solution for ConceptDraw DIAGRAM software perfectly suits this goal. The user-friendly interface and drag-and-drop features are useful to design the family tree in minutes. It is extremely easy to use, offers a collection of vector design elements — family tree, a large variety of samples that you can modify with a few simple clicks, and templates to fill with your data and add your photos. Customize the included templates to make the drawing process easier and faster. Create your family tree without any restrictions. Connect and change shapes, add comments, edit colors, and add images, photos, attractive design elements, and clipart to visualize your family tree. Visual aspects are incredibly important, they make your family tree eye-catching.

Example 3. Kennedy Family Tree
The Family Trees samples you see on this page were created in ConceptDraw DIAGRAM software using the drawing tools of the Family Tree Solution. These examples successfully demonstrate solution's capabilities and the professional results you can achieve using it. An experienced user spent 10-15 minutes creating each of these samples.
Use the powerful tools of the Family Tree solution to design your own Family Trees and Genograms quick, easily, and effectively.
All source documents are vector graphic documents. They are available for reviewing, modifying, or converting to a variety of formats (PDF file, MS PowerPoint, MS Visio, and many other graphic formats) from the ConceptDraw STORE. The Family Tree Solution is available for ConceptDraw DIAGRAM users.


Use the libraries with a set of vector objects, templates and samples from the Floor Plans Solution from the Building Plans area of ConceptDraw Solution Park for designing your professional architectural designs.


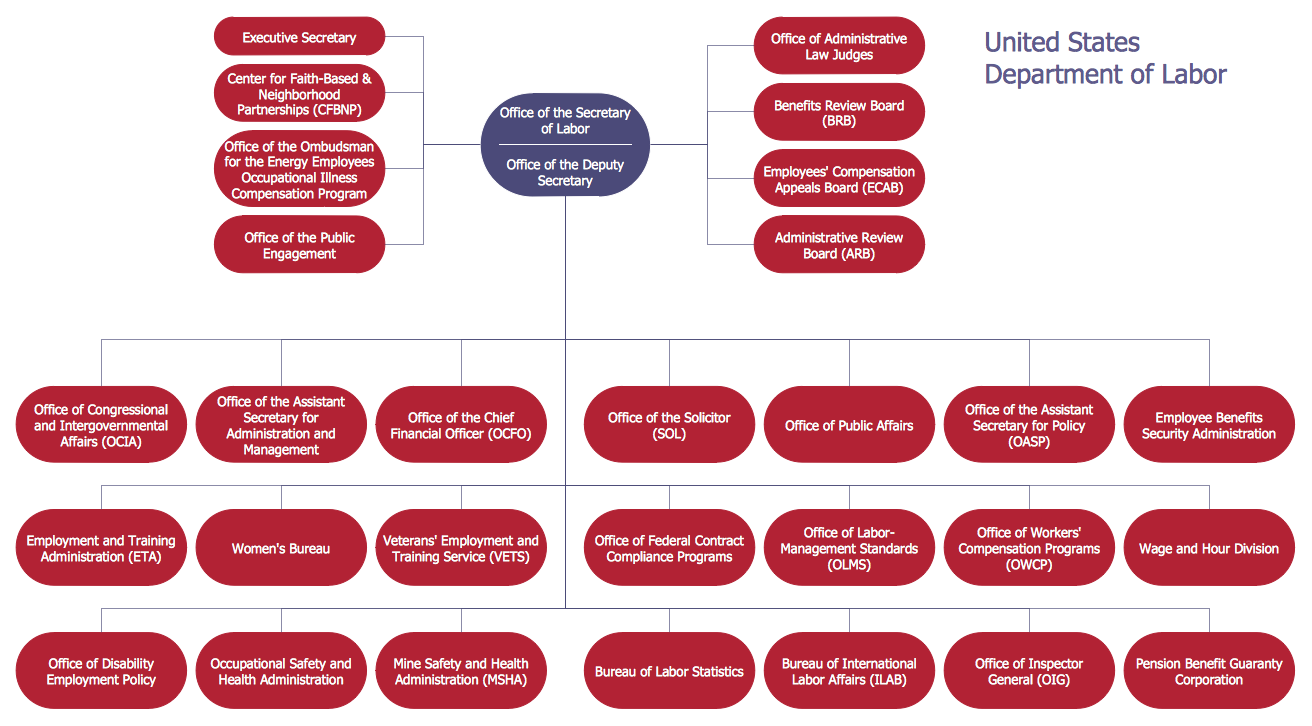
Draw Company Structure Diagram - get the detailed information about the company structure and hierarchy - who execute what tasks and who is in charge at this company. This information shows the reasoning and success of business and is indispensable for investors and financial institutions.