
Sample 1. Cross-functional flowchart - Credit approval process.
ConceptDraw DIAGRAM diagramming software provides vector shapes and connector tools for quick and easy drawing diagrams for business, technology, science and education.
Use ConceptDraw DIAGRAM enhanced with solutions from ConceptDraw Solution Park to create diagrams to present and explain structures, process flows, logical relationships, networks, design schemes and other visually organized information and knowledge.
TEN RELATED HOW TO's:
A network diagram is used to depict the topology of a computer network or, talking more broadly, any telecommunications network in general. In order for a computer network diagram to be understandable, clearly identifiable icons must be used for each network appliance. Cisco network templates, also called Network Topology Icons, is a brand of symbols developed and used by Cisco. Since Cisco Systems is the largest networking company in the world, it's list of networking symbols is widely recognized and exhaustive.
The diagram of the ISG network topology diagram illustrates the Cisco Intelligent Services Gateway. Since Cicso company offers service providers a possibility to provide control of state and resources in a broadband network, network architects and engineers need some facilities to create ISG topology diagrams.This Cisco ISG network diagram was created in ConceptDraw DIAGRAM using its solution for Cisco network diagrams. The vector library of this solution comprises over 500 icons of Cisco hardware and accessories. They can be used to design LAN, WAN, ISG and other Cisco equipped network diagrams.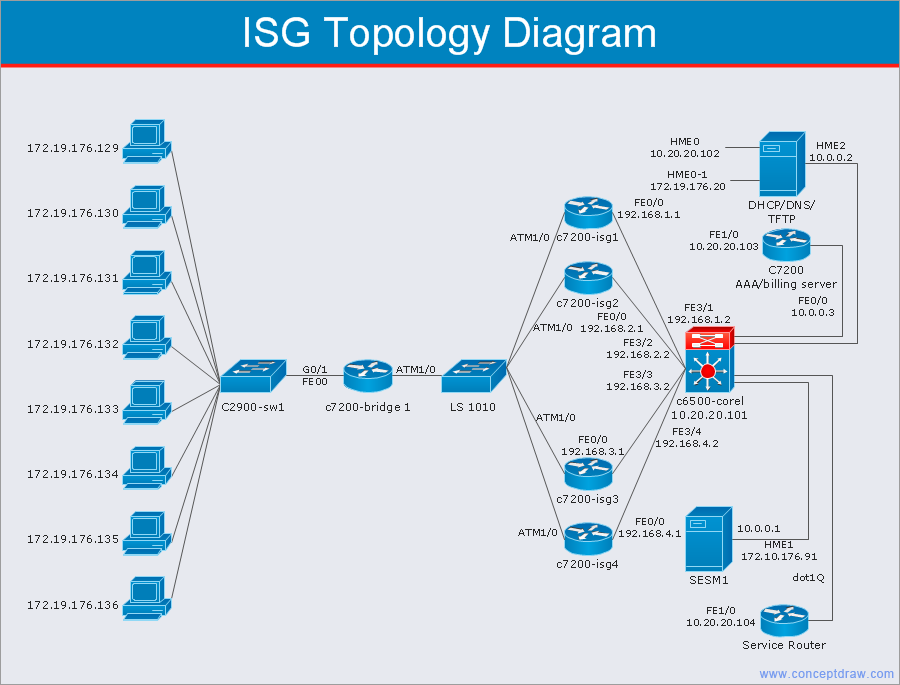
Picture: Cisco Network Templates
Related Solution:
A flowchart is a picture of the separate steps of a process in sequential order.
ConceptDraw DIAGRAM is a Process Flowcharts software. This software includes basic package of process flow examples. The software contains object libraries with vector stencils that allows you use RapidDraw technology. By clicking on direction arrows you can add a new object to the flowchart.
Picture: Example Process Flow
Related Solution:
Professional software: visualize general system architecture, AWS diagrams are part of architecturing tools provided with ConceptDraw Solution Park.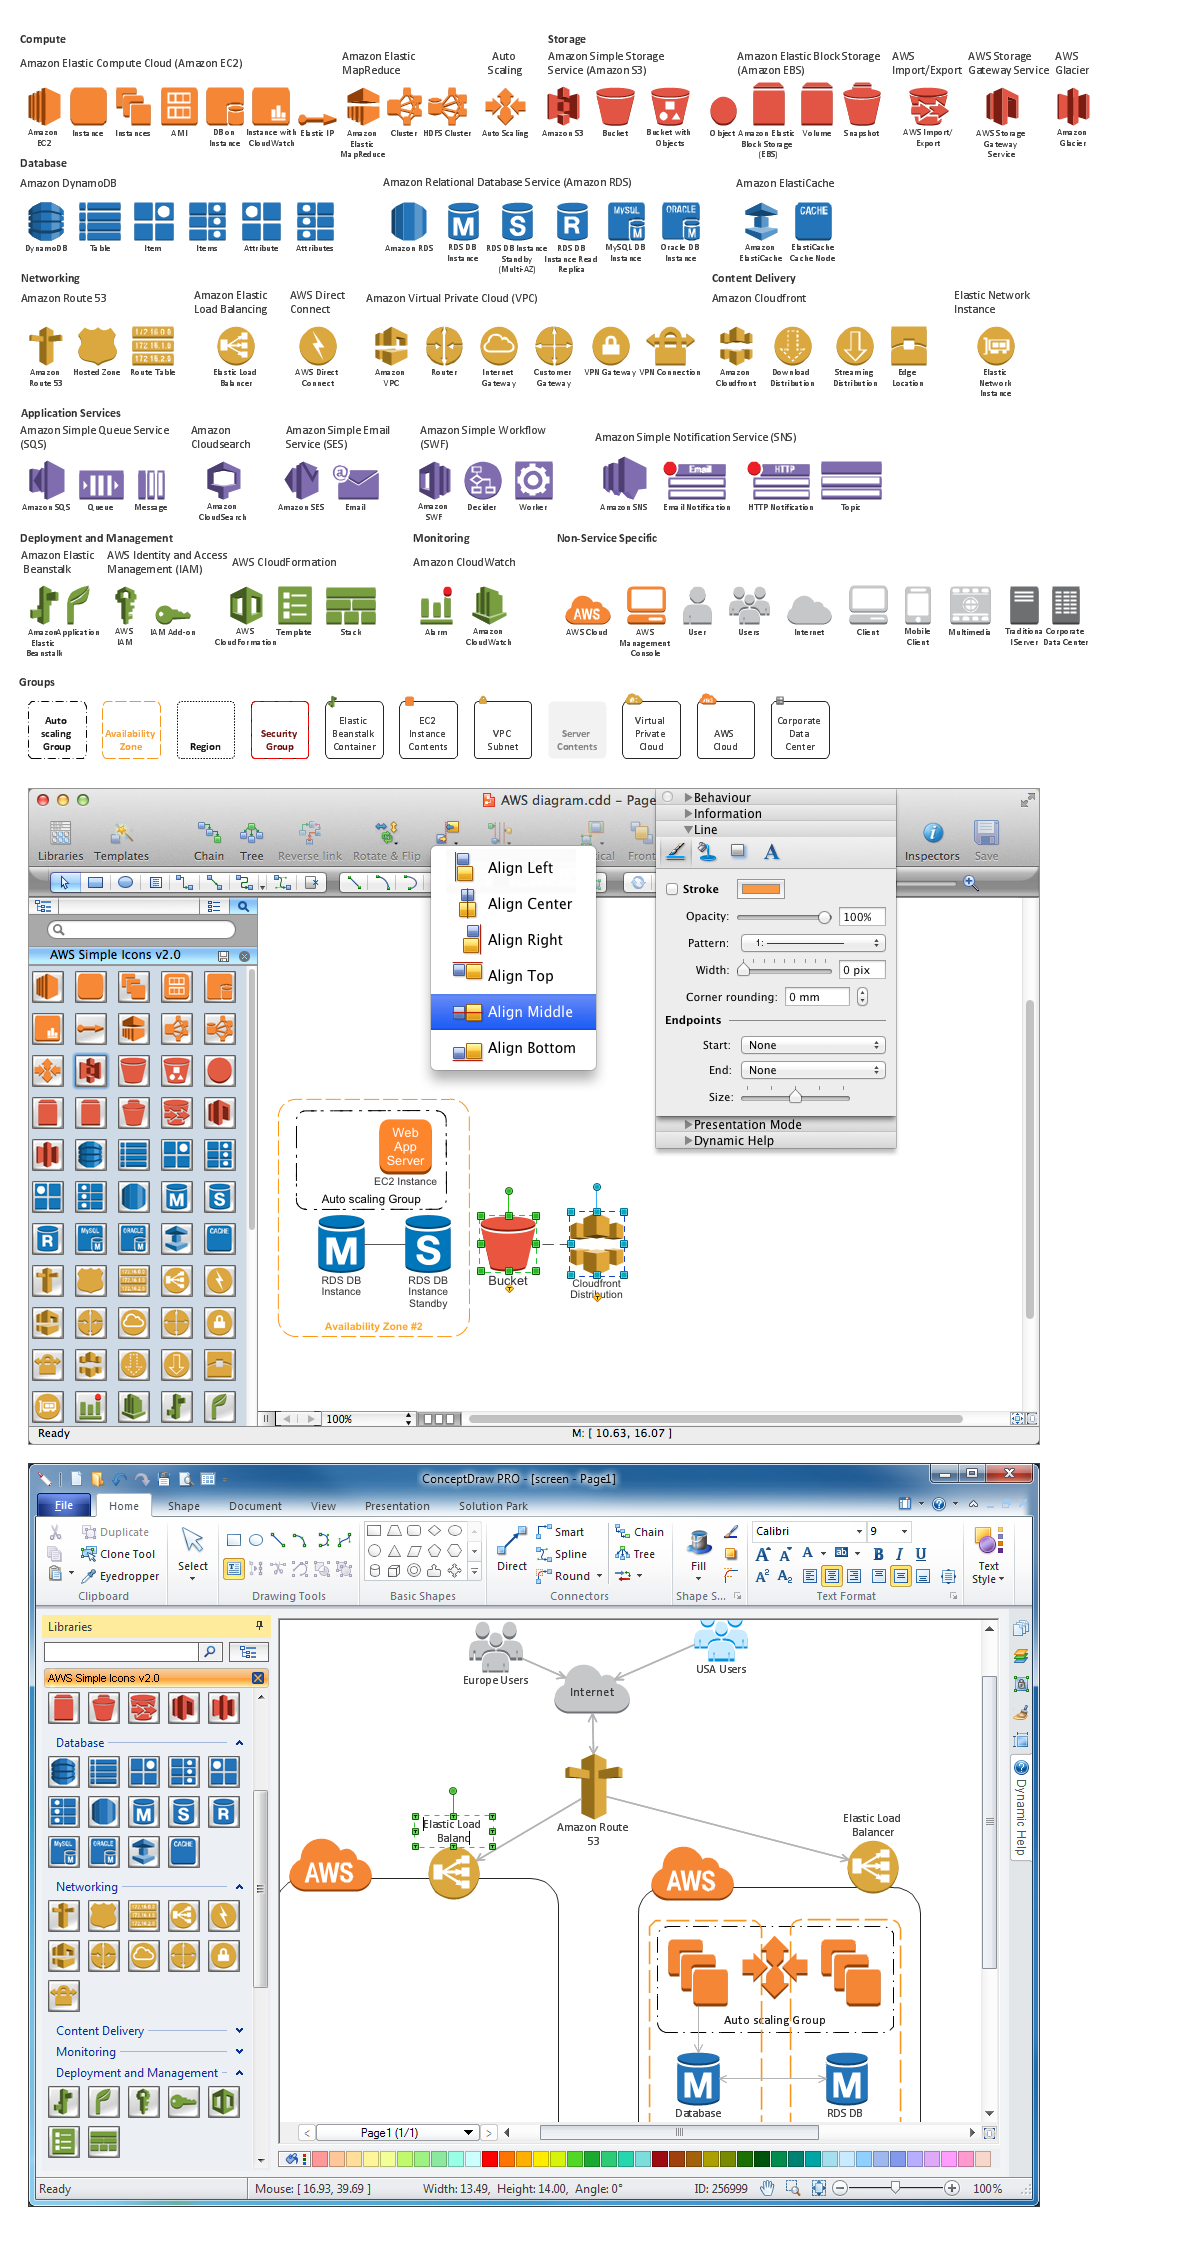
Picture: Diagramming software for Amazon Web Service diagrams, charts and schemes
ConceptDraw DIAGRAM diagramming software provides vector shapes and connector tools for quick and easy drawing diagrams for business, technology, science and education.
Use ConceptDraw DIAGRAM enhanced with solutions from ConceptDraw Solution Park to create diagrams to present and explain structures, process flows, logical relationships, networks, design schemes and other visually organized information and knowledge.
Picture: Cross-Functional Flowchart - The easiest way to draw crossfunctional
ConceptDraw DIAGRAM is a Mac OS X and Windows platforms professional software to draw your own business process diagrams and flowcharts.
Picture: Professional Diagram and Flowchart Software
ConceptDraw DIAGRAM extended with Fire and Emergency Plans solution from the Building Plans area of ConceptDraw Solution Park lets you make a Fire Exit Plan of any complexity in minutes.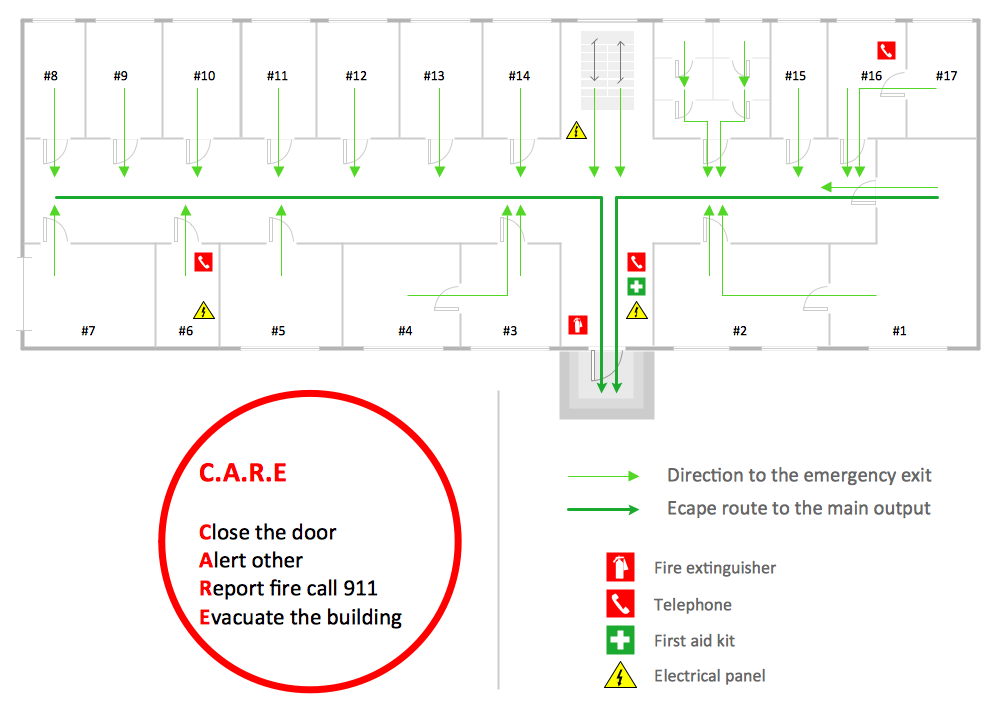
Picture: Fire Exit Plan
Related Solution:
Also included are standardized hr flowchart symbols, meaning your diagrams will be relevant and understood by all business associates.
Picture: HR Flowchart Symbols
Related Solution:
The Flowchart is a very popular type of diagram, it is widely used for analyzing, designing, managing and visualizing the business and technical processes, various software algorithms. But how to create Flowchart quick and easy?
Flowcharts solution from the Diagrams area of ConceptDraw Solution Park helps you to design the professional looking Flowchart Diagrams quick and easy using the ConceptDraw DIAGRAM diagramming and vector drawing software.
Picture: Create Flowchart - Making a Flowchart
Related Solution:
What are the favorite educational technology tools and techniques for teachers? Of course these are pictures, images and education infographics! ConceptDraw DIAGRAM software supplied with Education Infographics Solution from the Business Infographics Area provides powerful drawing tools to help design the education infographics of any complexity.
Picture: Educational Technology Tools
Related Solution:
Use the set of special professionally developed swim lane flowchart symbols - single, multiple, vertical and horizontal lanes from the Swimlanes and Swimlanes BPMN 1.2 libraries from the Business Process Diagram solution, the Swim Lanes library from the Business Process Mapping solution as the perfect basis for your Swim Lane Flowcharts of processes, algorithms and procedures.
Picture: Swim Lane Flowchart Symbols
Related Solution: