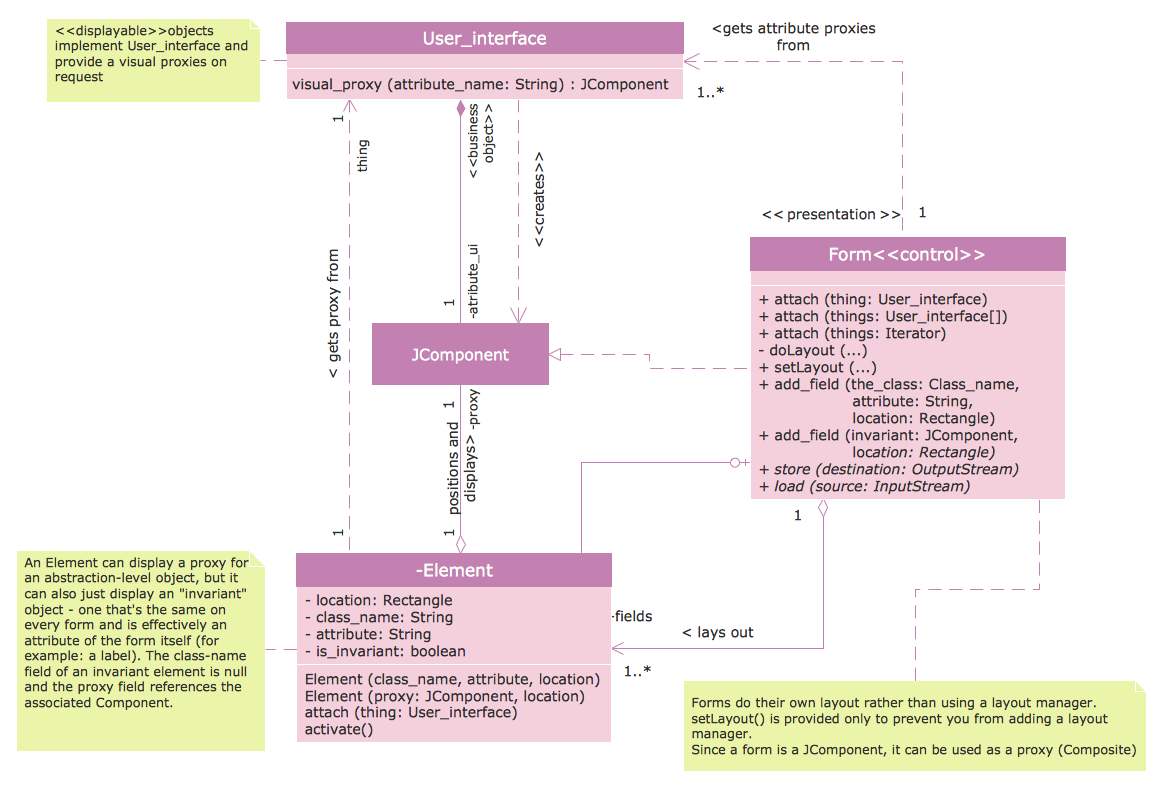
Sample 1. Class Diagram Tool
The Rapid UML Solution offers the UML Class Diagram library for quick and easy drawing professional looking UML Class diagrams. This library contains 38 vector objects of UML Class diagrams building blocks.

Sample 2. Class Diagram Tool - UML Class Library Design Elements
Use these objects to design the UML Class diagrams, to show the classes of system and their attributes, operations and methods, and the relationships among the classes.
The Rapid UML Solution contains also a large set of predesigned templates and samples of UML diagrams, including the UML Class diagrams. All they are available for viewing and editing from ConceptDraw STORE - the incredibly useful tool that allows to navigate through all solutions of ConceptDraw Solution Park and get access to all their libraries, templates and samples.

Sample 3. UML Class Diagram - Metadata Information Model
The samples you see on this page were created in ConceptDraw DIAGRAM using the vector objects from the UML Class Diagram library of Rapid UML Solution. These samples demonstrate the solution's capabilities and the professional results you can achieve. An experienced user spent 10 minutes creating every of these samples.
Use the Rapid UML solution to create your own UML Class diagrams and other types of UML diagrams quick, easy and effective.
All source documents are vector graphic documents. They are available for reviewing, modifying, or converting to a variety of formats (PDF file, MS PowerPoint, MS Visio, and many other graphic formats) from the ConceptDraw STORE. The Rapid UML Solution is available for all ConceptDraw DIAGRAM or later users.
NINE RELATED HOW TO's:
This sample shows the concept of working of the transport company and is used by transport companies, carriers at the transportation of various goods.
Picture: UML Class Diagram Example for GoodsTransportation System
Related Solution:
You can use many tools to create a representation of a system behavior or a scheme of objects relationships. Some of them are quite abstract and useless, and some, like UML tools help clarifying both the structure and the behavior of a system. There are various types of uml diagrams and tons of examples explaining the difference between them.
UML 2.2 specification has many kinds of diagrams. They are divided into two groups( structure and behavior diagrams). This class diagram shows the hierarchical structure of UML 2.2 specification. Class diagram - the most suitable tool for this task because it is designed to describe basic structure of a system. This diagram can be use as a visual aid for learning UML.
Picture: UML Tool & UML Diagram Examples
Related Solution:
What Is a Circle Spoke Diagram? It is a diagram which has a central item surrounded by other items in a circle. The Circle Spoke Diagrams are often used to show the features or components of the central item in marketing and management documents and presentations. ConceptDraw DIAGRAM extended with Business Diagrams Solution from the Management Area is the best software for creating Circle-Spoke Diagrams.
Picture: What Is a Circle Spoke Diagram
Related Solution:
The UML diagram is a powerful tool which lets visually represent all system's components, the interactions between them and relationships with external user interface.
The Rapid UML solution for ConceptDraw DIAGRAM software offers diversity of UML flowchart symbols for drawing all types of UML diagrams.
Picture: UML Flowchart Symbols
Related Solution:
UML Apartment Plan. This sample was created in ConceptDraw DIAGRAM diagramming and vector drawing software using the UML Class Diagram library of the Rapid UML Solution from the Software Development area of ConceptDraw Solution Park.
This sample show the detailed plan of the apartment and is used by building companies, design apartments, real estate agencies, at the buying / selling of the realty.
Picture: UML Class Diagram Example - Apartment Plan
Related Solution:
This sample was created in ConceptDraw DIAGRAM diagramming and vector drawing software using the UML Class Diagram library of the Rapid UML Solution from the Software Development area of ConceptDraw Solution Park.
This sample describes the use of the classes, the generalization associations between them, the multiplicity of associations and constraints. Provided UML diagram is one of the examples set that are part of Rapid UML solution.
Picture: UML Class Diagram Generalization ExampleUML Diagrams
Related Solution:
Developing a software project supposes architecture first. To make it proper, you can use data flow diagram model in your current project.
The data flow diagram represents the Model of small traditional production enterprise that is made using Yourdon and Coad notation. It shows how the data is transfered through a process. According to the notation of Yourdon and Coad a process is represented by circles and data stores are drawn using parallel lines. This DFD was created using the ConceptDraw Data Flow Diagrams solution. Using this solution one can visualize data flow accordingly to the rules of two basic notations used for data flow modeling.
Picture: Data Flow Diagram Model
Related Solution:
A wireframe is a scheme of a future web page. Wireframe illustrates the web page structure, location and size of the main elements, as well as their interaction with the user. With such scheme designer defines the functionality of the page, not its appearance.
Picture: Wireframe Tools
Related Solution:
Website wire frame is a schematic representation of a website framework. Wireframes are incredibly useful tool for depicting the arrangement of interface elements, navigational systems and website content, they display functionality and interactions between website elements.
Use the Website Wireframe solution from the Software Development area of ConceptDraw Solution Park to facilitate a wire frame production.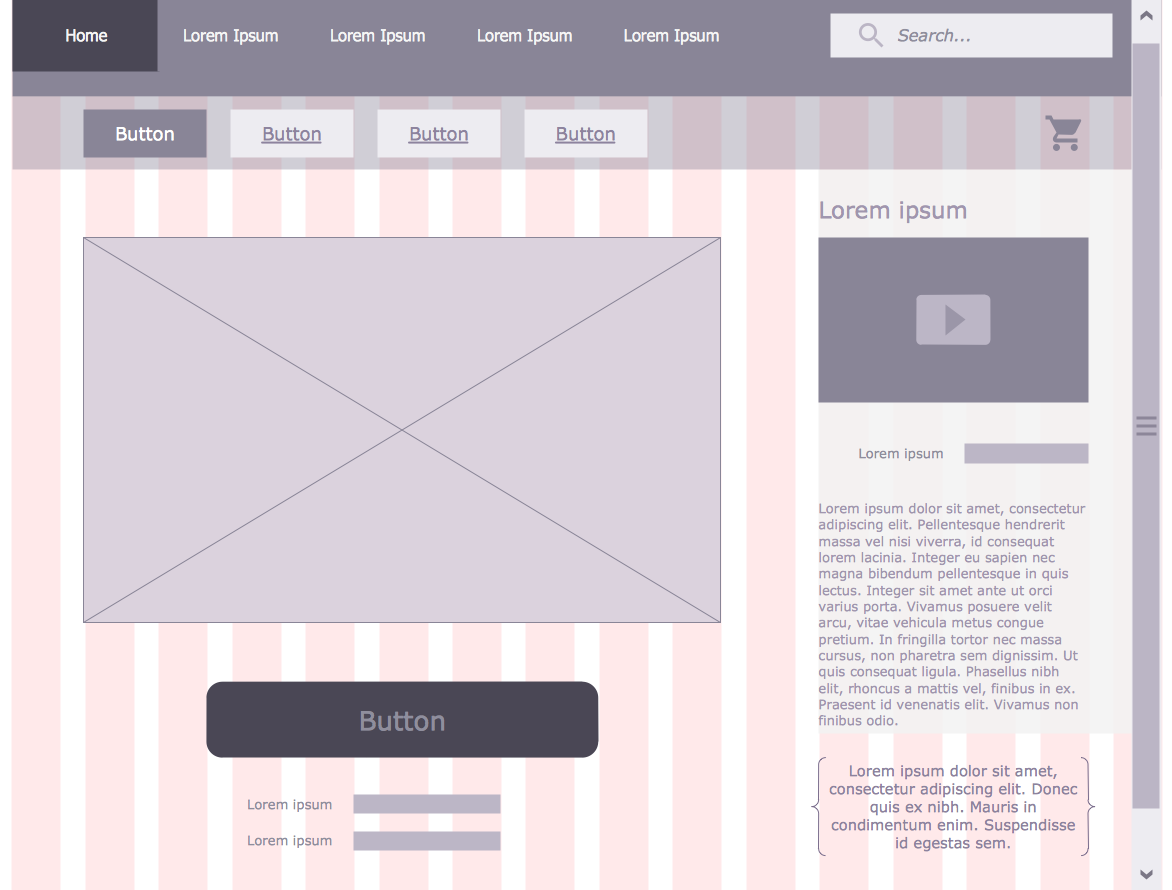
Picture: Wire Frame
Related Solution:

