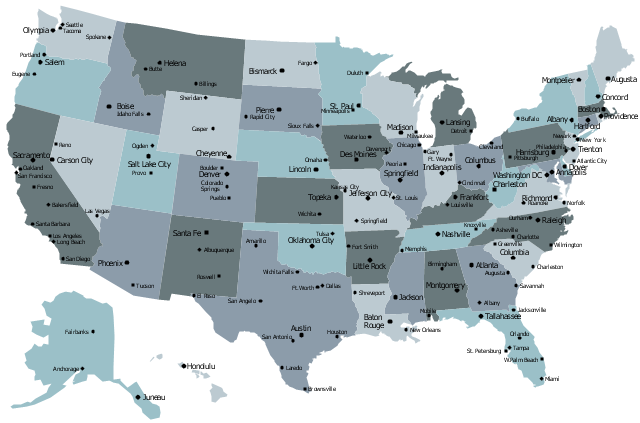
United States of America Map

Geo Map - United States of America Map
Drawing Geo map of all United States of America, which are Alabama, Alaska, Arizona, Arkansas, California, Colorado, Connecticut, Delaware, Florida, Georgia, Hawaii, Idaho, Illinois, Indiana, Iowa, Kansas, Kentucky, Louisiana, Maine, Maryland, Massachusetts, Michigan, Minnesota, Mississippi, Missouri, Montana, Nebraska, Nevada, New Hampshire, New Jersey, New Mexico, New York, North Carolina, North Dakota, Ohio, Oklahoma, Oregon, Pennsylvania, Rhode Island, South Carolina, South Dakota, Tennessee, Texas, Utah, Vermont, Virginia, Washington, West Virginia, Wisconsin and Wyoming, you need a proper software where you can create very good looking map so it looks professional and very sophisticated. Making it using ConceptDraw DIAGRAM is a very good option as this application allows to make any kind of map, as well as plans, charts, flowcharts, diagrams and schemes in minutes having all existing examples and templates of already previously made maps. Using our stencil libraries with so many design elements guarantees your final map to be looking simply great.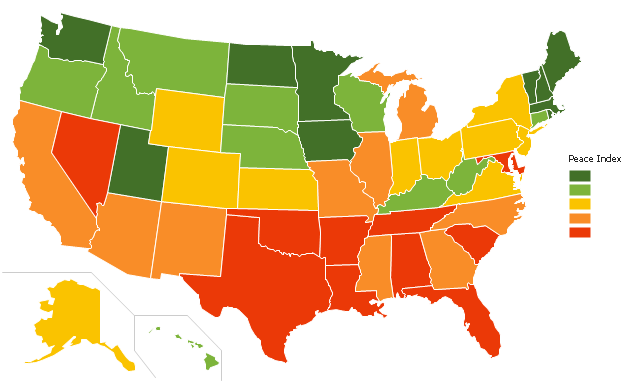
"The United States Peace Index (USPI) is a measurement of American States and
cities by their peacefulness. Created by the Institute for Economics and Peace,
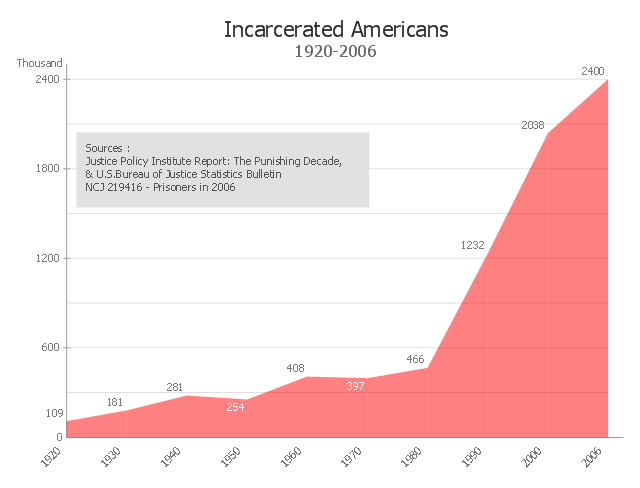
This area chart sample shows the timeline of total number of inmates in U.S.
prisons, jails, and juvenile facilities from 1920 to 2006. It was redesigned from the
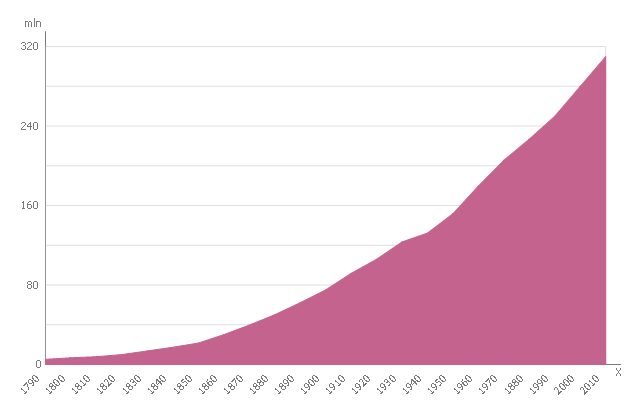
This area chart sample shows the U.S. population (1790-2010). The reference
points were obtained from official United States Census data. This area chart
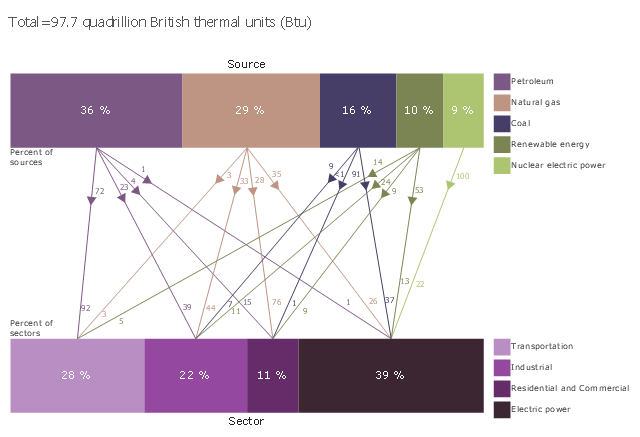
This divided bar diagram sample shows U.S. primary energy consumption by
source and sector in 2015. It was designed using data from the chart in the

This area chart sample shows the US federal prisoner population changes from
1914 to 2010. "The Federal Bureau of Prisons (BOP) is a United States federal
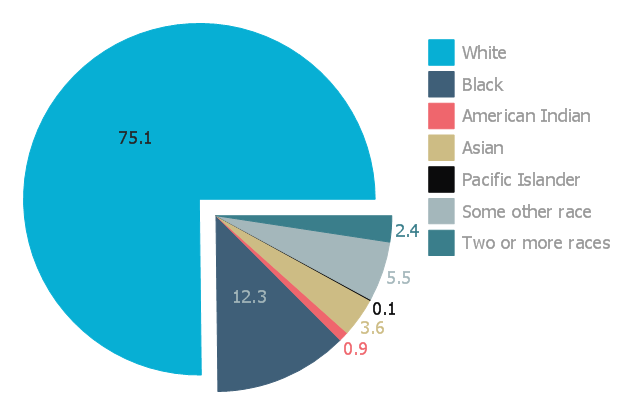
This exploded pie chart sample shows the racial make-up of the U.S. in 2000. It
was designed on the base of the Wikimedia Commons file: Percentages of the us
The vector stencils library "Management map US " contains 51 state map contours
of US . Use it to create your management infogram in the ConceptDraw PRO
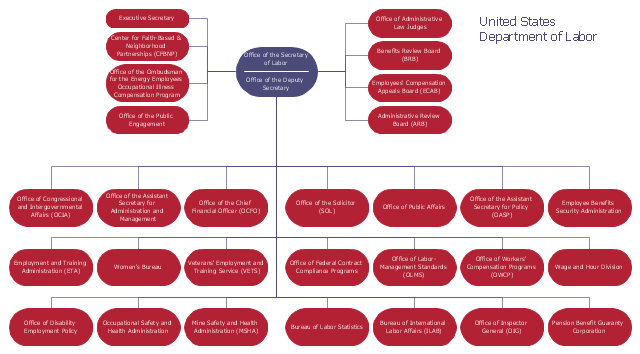
This organization chart sample was created on the base of the figure from the
website of U.S. Department of Labor. [dol.gov/dol/aboutdol/orgchart.htm] "The

This pie chart sample shows the make up of the top one percent of United States
wage earners, grouped by occupation. Data for this graph is sourced from the
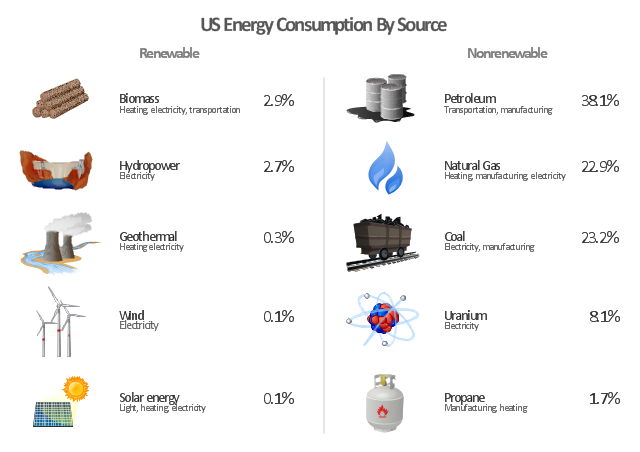
"The United States is the 800th largest energy consumer in terms of total use in
2010. The majority of this energy is derived from fossil fuels: in 2010, data

This vertical bar chart sample shows the percentage of U.S. high school students.
It was designed on the base of the bar graph from the article "Childhood
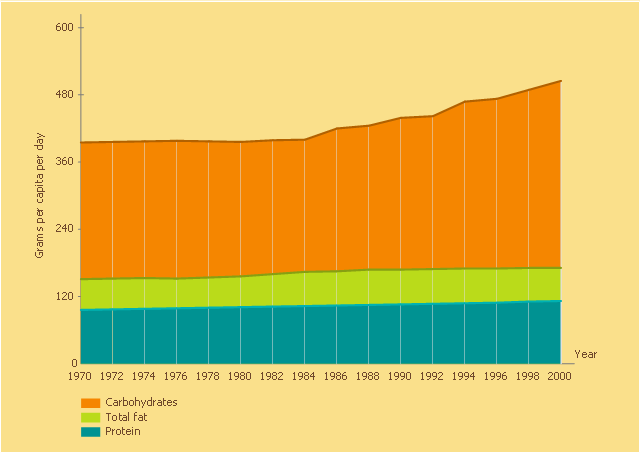
This area chart sample was designed on the base of line graph "Figure 9. U.S.
food supply of macronutrients in grams per capita per day, 1970–2000. Data from
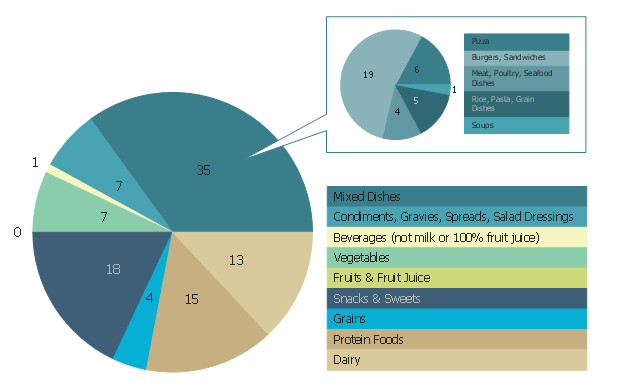
This pie chart sample shows the percentage of saturated fats in the U.S.
population diet. It was designed on the base of figure 2-12. "Food Category
Sources of
- Geo Map - United States of America Map | Ranks US states by ...
- Join Us
- Geo Map - United States of America Map | Geo Map - USA ...
- USA Maps | Geo Map - USA - Kansas | Geo Map - United States of ...
- Geo Map - United States of America Map | Map of USA States | USA ...
- Benefit Corporation legislation - Thematic map | United States ...
- Percentage of the top 1% wage earners in the US by occupation ...
- Ranks US states by peacefulness | Geo Map - United States of ...
- Geo Map - United States of America Map | USA Map States | Map of ...
- Step Area Graph | US incarceration timeline-clean - Area graph | US ...
- LLNL Flow Charts | USA Maps | Think. Act. Accomplish. | About Us
- Geo Map - United States of America Map | Benefit Corporation ...
- Geo Map - USA - Maryland | Management map US - Vector stencils ...
- How To Draw The United States With Their Full Names
- Geo Map - United States of America Map | Map of USA States | Map ...
- Geo Map - United States of America Map | Map 0f Us States
- Geo Map - United States of America Map | Map of USA | Design ...
- USA Maps | Geo Map - United States of America Map | Map of USA ...
- Us Map With Largest Cities
- Geo Map - United States of America Map | USA Maps | Map of USA ...