Reporting Dashboard Software for Business
Sales Dashboard Solution
The Sales Dashboard Solution gives users the ability to use live data to drive displays that show sales performance in a wide variety of graphs. ConceptDraw DIAGRAM is a software for making Live charts anв gauges that provide effectiveness to your business. Dashboards allow you to capture and report specific data points from each department within the organization, thus providing a "snapshot" of performance. By using dashboards one obtain benefits:
- Measure efficiencies/inefficiencies
- Ability to generate detailed reports
- Saves time compared to running multiple reports
- Gain total visibility of all systems instantly
Pic. 1. Sales Dashboard Design Elements (Apple macOS)
THREE RELATED HOW TO's:
ConceptDraw Office is the most effective tool for planning, tracking, and reporting all types of projects with strong management capabilities, user friendly functionality, and superior ease of use. In this tutorial video we will assist you in planning and managing a project using ConceptDraw Office.
Picture: How To Plan and Implement Projects Faster
Communication is the main challenge and the key success factor for remote project management. Communicating visually via Skype you bring all team and customers onto the one page.
Remote Presentation for Skype solution for ConceptDraw MINDMAP helps communicate with remote team and customers in visual manner on wide range of issues. Using this solution for regular status meetings allows you to push your team on tasks and keep task statuses up to date.
Picture: Communication Tool for Remote Project Management
Related Solution:
Project progress on web: delivering project status to remote teams and stakeholders via Skype.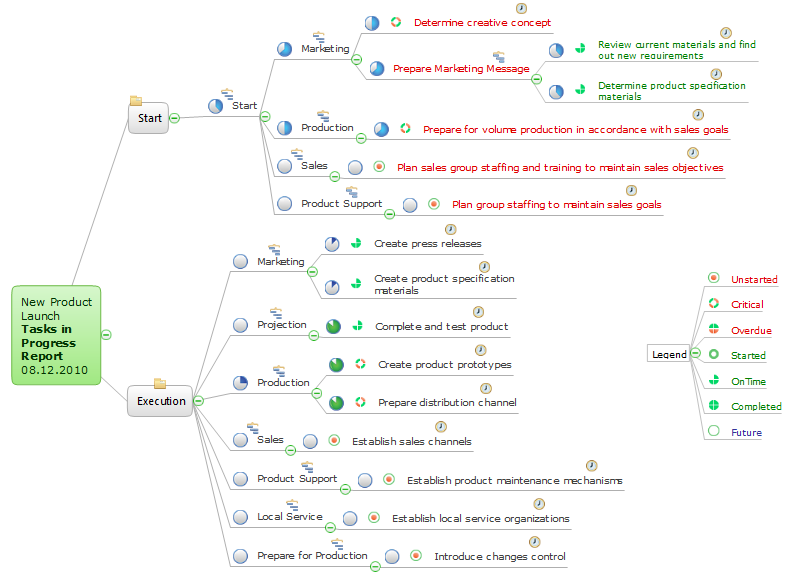
Picture: How To Show Project Progress Peport on Web
Related Solution:
ConceptDraw
DIAGRAM 18