HelpDesk
How to Add a Rack Diagram to MS Word Document
 Rack Diagrams
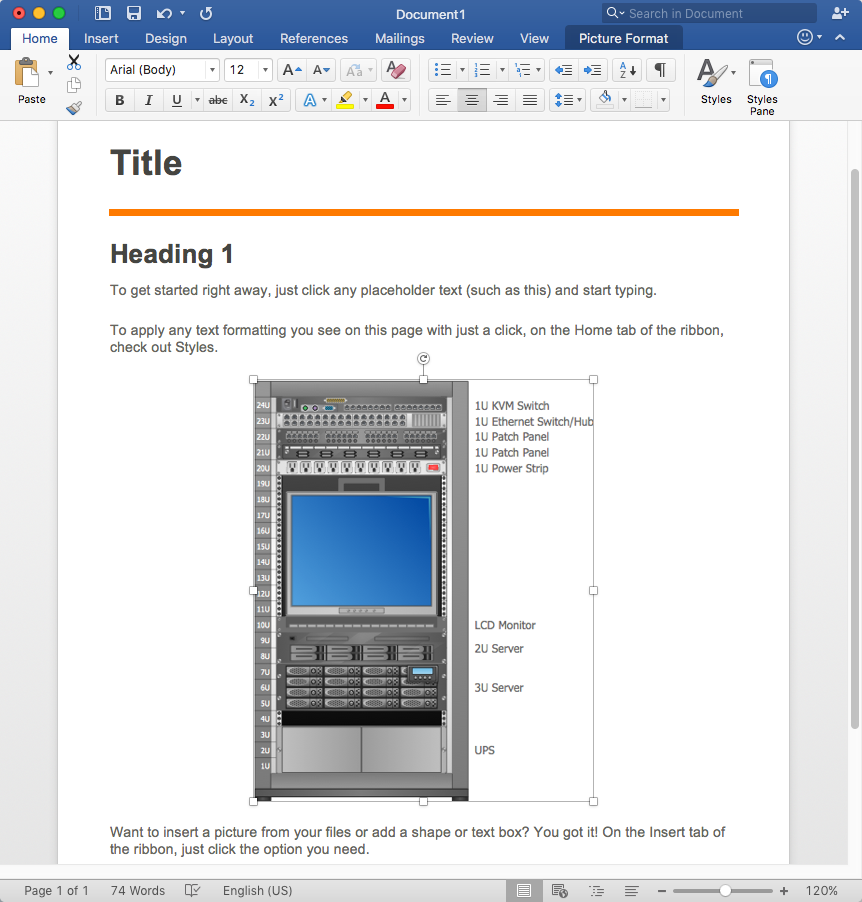
The Rack Diagrams solution, including a vector stencil library, a collection of samples and a quick-start template, can be useful for all who deal with computer networks. Choosing any of the 54 library's vector shapes, you can design various types of Rack diagrams or Server rack diagrams visualizing 19" rack mounted computers and servers.
Server rack diagrams visualize the rack mounting of a computer and network equipment as a frontal view of the rack with the equipment installed. They are used when choosing which equipment or racks to buy, and to see if a particular configuration works, without having to go through a physical install.
"In the hardware sense, the word server typically designates computer models intended for hosting software applications under the heavy demand of a network environment. In this client–server configuration, one or more machines, either a computer or a computer appliance, share information with each other with one acting as a host for the other[s].
While nearly any personal computer is capable of acting as a network server, a dedicated server will contain features making it more suitable for production environments. These features may include a faster CPU, increased high-performance RAM, and increased storage capacity in the form of a larger or multiple hard drives. Servers also typically have reliability, availability and serviceability (RAS) and fault tolerance features, such as redundancy in power supplies, storage (as in RAID), and network connections." [Server (computing). Wikipedia]
This network server rack diagram example was created using the ConceptDraw PRO diagramming and vector drawing software extended with the Rack Diagrams solution from the Computer and Networks area of ConceptDraw Solution Park.
Server rack diagram

 Word Exchange
This solution extends ConceptDraw MINDMAP software with the ability to quickly create the framework for a future article or book, fill the structure with ideas, and use it to produce an MS Word document with just a simple click of the mouse.
 Divided Bar Diagrams
The Divided Bar Diagrams Solution extends the capabilities of ConceptDraw DIAGRAM with templates, samples, and a library of vector stencils for drawing high impact and professional Divided Bar Diagrams and Graphs, Bar Diagram Math, and Stacked Graph.
 IDEF0 Diagrams
IDEF0 Diagrams visualize system models using the Integration Definition for Function Modeling (IDEF) methodology. Use them for analysis, development and integration of information and software systems, and business process modelling.
 Seven Basic Tools of Quality
Manage quality control in the workplace, using fishbone diagrams, flowcharts, Pareto charts and histograms, provided by the Seven Basic Tools of Quality solution.
 Computer Network Diagrams
Computer Network Diagrams solution extends ConceptDraw DIAGRAM software with samples, templates and libraries of vector icons and objects of computer network devices and network components to help you create professional-looking Computer Network Diagrams, to plan simple home networks and complex computer network configurations for large buildings, to represent their schemes in a comprehensible graphical view, to document computer networks configurations, to depict the interactions between network's components, the used protocols and topologies, to represent physical and logical network structures, to compare visually different topologies and to depict their combinations, to represent in details the network structure with help of schemes, to study and analyze the network configurations, to communicate effectively to engineers, stakeholders and end-users, to track network working and troubleshoot, if necessary.
ConceptDraw DIAGRAM Comparison with Omnigraffle Professional and MS Visio
 Logistics Flow Charts
Logistics Flow Charts solution extends ConceptDraw DIAGRAM functionality with opportunities of powerful logistics management software. It provides large collection of predesigned vector logistic symbols, pictograms, objects and clipart to help you design with pleasure Logistics flow chart, Logistics process flow diagram, Inventory flow chart, Warehouse flowchart, Warehouse management flow chart, Inventory control flowchart, or any other Logistics diagram. Use this solution for logistics planning, to reflect logistics activities and processes of an enterprise or firm, to depict the company's supply chains, to demonstrate the ways of enhancing the economic stability on the market, to realize logistics reforms and effective products' promotion.
- Rack Diagrams | How to Create a Rack Diagram in ConceptDraw ...
- How to Add a Rack Diagram to a MS Word Document Using ...
- How to Add a Block Diagram to a MS Word ™ Document Using ...
- How to Add a Rack Diagram to a MS Word Document Using ...
- How to Add a Block Diagram to a MS Word ™ Document Using ...
- How to Add a Rack Diagram to a PowerPoint Presentation Using ...
- Design Element: Rack Diagram for Network Diagrams | Rack ...
- How to Create a Rack Diagram in ConceptDraw PRO | How to Add a ...
- How to Add a Wireless Network Diagram to a MS Word Document ...
- How to Add a Network Diagram to a MS Word Document Using ...