 Venn Diagrams
Venn Diagrams are actively used to illustrate simple set relationships in set theory and probability theory, logic and statistics, mathematics and computer science, linguistics, sociology, and marketing. Venn Diagrams are also often used to visually summarize the status and future viability of a project.
 ConceptDraw Solution Park
ConceptDraw Solution Park collects graphic extensions, examples and learning materials
HelpDesk
How to Create a Venn Diagram in ConceptDraw PRO
Venn diagrams were invented by John Venn as a method of depicting relationships between different components. A Venn diagram consists of two or more circles. Each circle represents a specific group or set. The entities which are depicted by circles generally have some common characteristics. A Venn Diagram shows all the possible logical relations between these entities. Any properties that belong to more than one set should be indicated in the sections where the circles overlap. A Venn Diagram can be useful to visually summarize the status and future viability of a project. ConceptDraw PRO allows you to make a Venn diagrams using the Venn Diagrams solution.HelpDesk
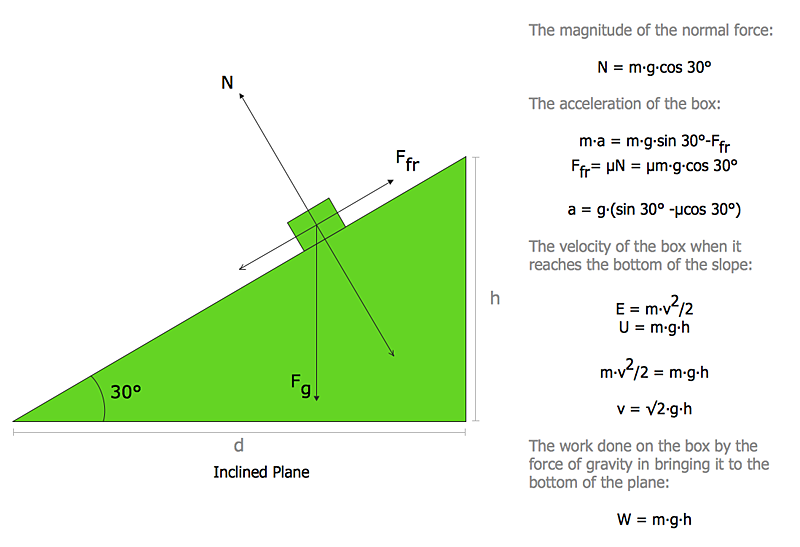
How to Draw Physics Diagrams in ConceptDraw PRO
Nothing is more helpful in the study of physics as a visual representation of the physical processes: physics schemes, diagrams and illustrations. Physics charts can be helpful when you learn Physics, perform experiments, or solve any other tasks regarding Physics. ConceptDraw PRO allows you to draw physical diagrams of mechanical, nuclear, optical and electrical processes using the set of vector physics symbols and physics diagram templates.- Graphic Maker Free Online
- Diagram Online Maker
- Timeline Maker Free
- Venn Diagram Maker | Venn Diagram Examples for Problem Solving ...
- Free Diagram Creator
- Online Free Flowchart Maker
- Flowchart Maker Online Free
- Onion Diagram Maker | Venn Diagram Maker | Bubble Chart Maker ...
- Math Graph Maker Online
- Online Charts And Graphs Maker
- Pyramid Chart Maker | Concept Map Maker | Form Maker | Free ...
- Venn Diagram Maker To Draw Venn Diagrams
- Online Diagram Creator Free
- Physics Diagram Maker Online
- Decision Tree Generator Online
- Best Diagramming Software for Mac | Venn Diagram Examples for ...
- Diagram Creator Online Free
- ConceptDraw Solution Park | Flow Chart Online | Physics Diagrams ...
- Draw Flowchart Online Free
- Venn Diagram Maker Free

