 Pie Charts
Pie Charts are extensively used in statistics and business for explaining data and work results, in mass media for comparison (i.e. to visualize the percentage for the parts of one total), and in many other fields. The Pie Charts solution for ConceptDraw PRO v10 offers powerful drawing tools, varied templates, samples, and a library of vector stencils for simple construction and design of Pie Charts, Donut Chart, and Pie Graph Worksheets.
The vector stencils library "Pie charts" contains 30 templates of pie and donut (doughnut, ring) charts for visualizing percentage for parts of one total, or compare parts of few totals.
Drag a template from the library into your document and enter your data.
Use these shapes to draw your pie charts and donut charts in the ConceptDraw PRO diagramming and vector drawing software.
The vector stencils library "Pie charts" is included in the Pie Charts solution of the Graphs and Charts area in ConceptDraw Solution Park.
Pie chart (table)
-pie-charts---vector-stencils-library.png--diagram-flowchart-example.png)
Pie chart

Percentage pie chart

Pie chart, control dots

Separated pie chart

Percentage separated pie chart

Pie chart with shifted slices

Percentage pie chart with shifted slices

Ring chart (table)
-pie-charts---vector-stencils-library.png--diagram-flowchart-example.png)
Ring chart

Percentage ring chart

Ring chart 2

Percentage ring chart 2

Ring chart, control dots

Arrow ring chart
Percentage arrow ring chart
Pie chart (light)
-pie-charts---vector-stencils-library.png--diagram-flowchart-example.png)
Percentage pie chart (light)
-pie-charts---vector-stencils-library.png--diagram-flowchart-example.png)
Pie chart (light), control dots
,-control-dots-pie-charts---vector-stencils-library.png--diagram-flowchart-example.png)
Separated pie chart (light)
-pie-charts---vector-stencils-library.png--diagram-flowchart-example.png)
Percentage separated pie chart (light)
-pie-charts---vector-stencils-library.png--diagram-flowchart-example.png)
Pie chart with shifted slices (light)
-pie-charts---vector-stencils-library.png--diagram-flowchart-example.png)
Percentage pie chart with shifted slices (light)
-pie-charts---vector-stencils-library.png--diagram-flowchart-example.png)
Ring chart (light)
-pie-charts---vector-stencils-library.png--diagram-flowchart-example.png)
Percentage ring chart (light)
-pie-charts---vector-stencils-library.png--diagram-flowchart-example.png)
Ring chart (light) 2
-2-pie-charts---vector-stencils-library.png--diagram-flowchart-example.png)
Percentage ring chart (light) 2
-2-pie-charts---vector-stencils-library.png--diagram-flowchart-example.png)
Ring chart (light), control dots
,-control-dots-pie-charts---vector-stencils-library.png--diagram-flowchart-example.png)
Arrow ring chart (light)
Percentage arrow ring chart (light)
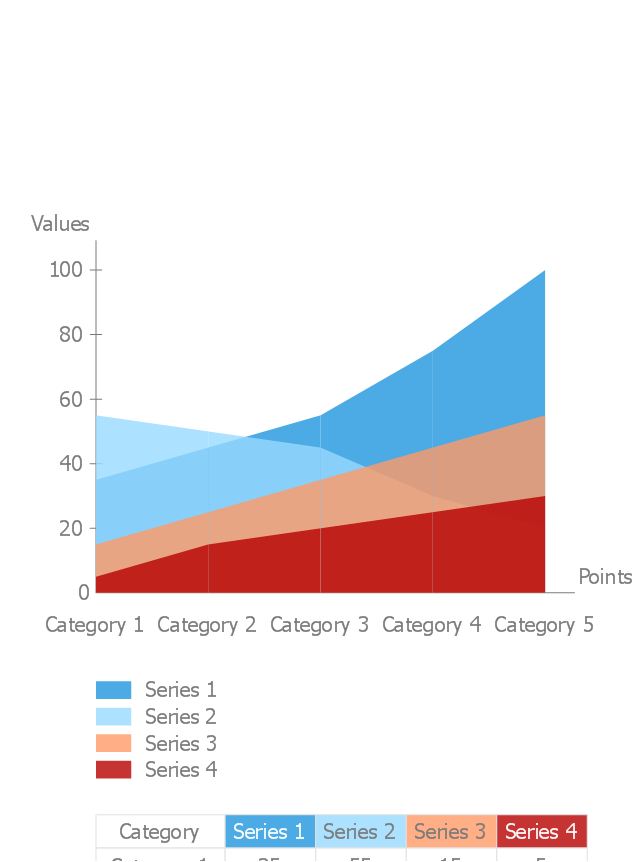
The vector stencils library "Area charts" contains 9 area chart templates you can drag into your document and set data by numbers entering or moving control dots. Use these templates to draw your area graphs in the ConceptDraw PRO diagramming and vector drawing software.
The vector stencils library "Area charts" is included in the Area Charts solution from the Graphs and Charts area of ConceptDraw Solution Park.
The vector stencils library "Area charts" is included in the Area Charts solution from the Graphs and Charts area of ConceptDraw Solution Park.
Area chart (control dots)
-area-charts---vector-stencils-library.png--diagram-flowchart-example.png)
Area chart (text -> height)
-area-charts---vector-stencils-library.png--diagram-flowchart-example.png)
Area chart (control dots)
-area-charts---vector-stencils-library.png--diagram-flowchart-example.png)
Area chart (text -> height)
-area-charts---vector-stencils-library.png--diagram-flowchart-example.png)
Area chart (control dots)
-area-charts---vector-stencils-library.png--diagram-flowchart-example.png)
Area chart (text -> height)
-area-charts---vector-stencils-library.png--diagram-flowchart-example.png)
Area chart (control dots)
-area-charts---vector-stencils-library.png--diagram-flowchart-example.png)
Area chart (text -> height)
-area-charts---vector-stencils-library.png--diagram-flowchart-example.png)
Area chart - serial
The vector stencils library "Education charts" contains 12 graphs and charts: area chart, column chart, divided bar diagram, histogram, horizontal bar graph, line graph, pie chart, ring chart, scatter plot.
Use it to create your education infogram in the ConceptDraw PRO diagramming and vector drawing software.
The vector stencils library "Education charts" is included in the Education Infographics solution from the Business Infographics area of ConceptDraw Solution Park.
Use it to create your education infogram in the ConceptDraw PRO diagramming and vector drawing software.
The vector stencils library "Education charts" is included in the Education Infographics solution from the Business Infographics area of ConceptDraw Solution Park.
Area chart - serial

Column chart

Column chart - serial

Divided bar diagram

Frequency histogram

Horizontal bar chart

Horizontal bar chart - serial

Line chart - serial

Pie chart

Ring chart

Scatter plot

Scatter plot - serial

- Waterfall Bar Chart | Geography - Vector stencils library | SSADM ...
- Dna Vector Images Png
- Chart Examples | Pie Charts | Chart Templates | Percentage Chart Png
- Arrows - Vector clipart library | Arrows - Vector clipart library | Chart ...
- Food - Vector stencils library | Histogram Chart | Make a Histogram ...
- Pie Charts | Pie Chart Examples and Templates | Circular diagrams ...
- Exploded pie chart - European Parliament election | Europe browser ...
- Dna Vector Png
- Circular diagrams - Vector stencils library | Pie Charts | Pie Chart | 2 ...
- Zodiac constellations - Vector stencils library | Design elements ...
- Professions - Vector stencils library | Management Consultant ...
- Line Chart Vector Png
- Column Chart Template | Sales workflow - Vector stencils library ...
- Structure Organization Vector Png
- Time Vector Png High Quality
- Bar Chart Examples | Bar Graphs | Picture Graphs | Bar Graph ...
- Chart Examples | Chart Templates | Pyramid Diagram | White ...
- Renewable energy | Pie Charts | Pie Chart Software | Donut Chart Png
- Constellation Chart | Illustration Software | Astronomy | Orion ...
- Horizontal Bar Chart Png