 Fishbone Diagram
Fishbone Diagrams solution extends ConceptDraw PRO software with templates, samples and library of vector stencils for drawing the Ishikawa diagrams for cause and effect analysis.
HelpDesk
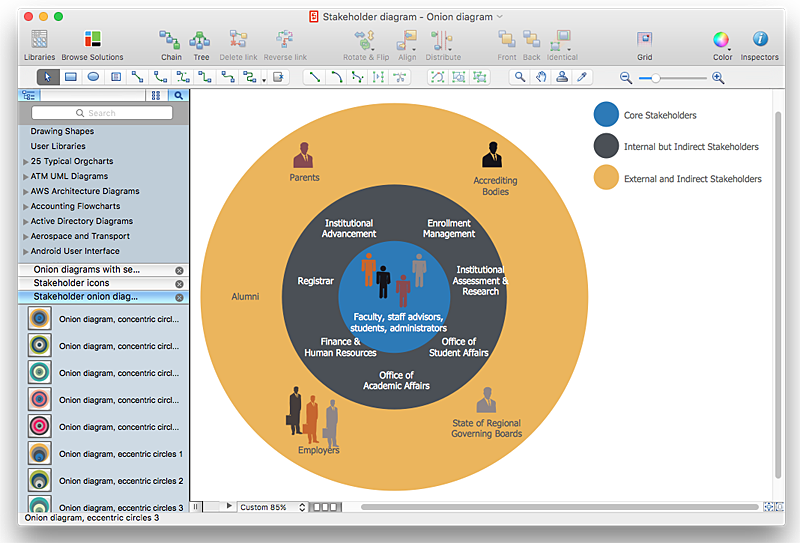
How to Create a Stakeholder Onion Diagram Using ConceptDraw PRO
The Stakeholder Onion Diagram is stakeholder analysis tool from the arsenal of project management. It is used to display the relationships of stakeholders to a project goal. An Onion Diagram shows how the stakeholder activities affect the project results. The ConceptDraw Stakeholder Onion Diagram solution is intended to depict how the relationships that subsists in a project environment can influence on a project. A set of libraries and objects provided by this solution make ashort work of visualizing the stakeholder analysis of a project.- PROBLEM ANALYSIS . Prioritization Matrix | PROBLEM ANALYSIS ...
- Cause and Effect Analysis ( Fishbone Diagrams) | Problem solving ...
- Cause and Effect Analysis ( Fishbone Diagrams) | Using Fishbone ...
- Problem solving | Cause and Effect Analysis ( Fishbone Diagrams ...
- Cause and Effect Analysis ( Fishbone Diagrams) | Cause and Effect ...
- Cause and Effect Analysis ( Fishbone Diagrams) | Cause and Effect ...
- Using Fishbone Diagrams for Problem Solving
- PROBLEM ANALYSIS . Relations Diagram | PROBLEM ANALYSIS ...
- PROBLEM ANALYSIS. Root Cause Analysis Tree Diagram ...
- Cause and Effect Analysis ( Fishbone Diagrams) | Business ...
- Using Fishbone Diagrams for Problem Solving
- Cause and Effect Analysis | Cause and Effect Analysis ( Fishbone ...
- PROBLEM ANALYSIS Identify and Structure Factors | Cause and ...
- Venn Diagram Examples for Problem Solving. Environmental Social
- Cause and Effect Analysis | Fishbone Diagram Software for Design ...
- Cause and Effect Analysis | Business Productivity Diagramming ...
- Cause and Effect Analysis | Cause and Effect Analysis ( Fishbone ...
- PROBLEM ANALYSIS Prioritization Matrix | Decision Making | The ...
- Bar Diagrams for Problem Solving. Create business management ...
- PROBLEM ANALYSIS. Root Cause Analysis Tree Diagram | Root ...
