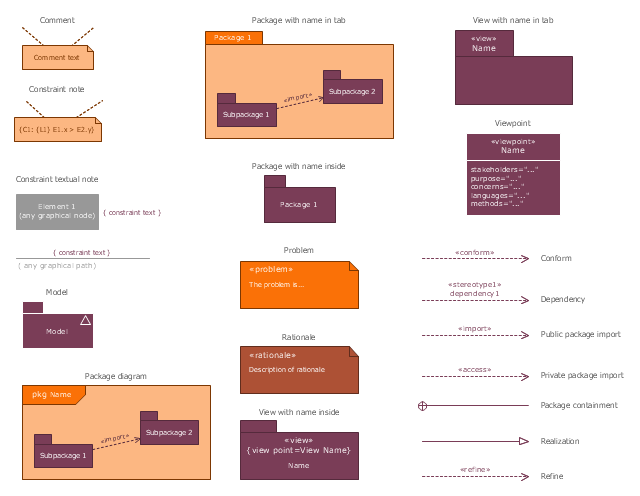
The vector stencils library "SysML diagrams" contains 19 symbols.
Use it to design your SysML diagrams using ConceptDraw PRO diagramming and vector drawing software.
"The Systems Modeling Language (SysML) is a general-purpose modeling language for systems engineering applications. It supports the specification, analysis, design, verification and validation of a broad range of systems and systems-of-systems.
SysML was originally developed by an open source specification project, and includes an open source license for distribution and use. SysML is defined as an extension of a subset of the Unified Modeling Language (UML) using UML's profile mechanism." [Systems Modeling Language. Wikipedia]
The building blocks example "Design elements - SysML diagrams" is included in the SysML solution from the Software Development area of ConceptDraw Solution Park.
SysML diagram building blocks
Visio Files and ConceptDraw

 Event-driven Process Chain Diagrams
Event-driven Process Chain (EPC) Diagram is a type of flowchart widely used for modeling in business engineering and reengineering, business process improvement, and analysis. EPC method was developed within the Architecture of Integrated Information Systems (ARIS) framework.
HelpDesk
How to Connect a Live Object to a Text Data Source


HelpDesk
How to Connect Tabular Data (CSV) to a Graphic Indicator on Your Live Dashboard

 Entity-Relationship Diagram (ERD)
Entity-Relationship Diagram (ERD) solution extends ConceptDraw PRO software with templates, samples and libraries of vector stencils from drawing the ER-diagrams by Chen's and crow’s foot notations.
- Uml Open Source Tool
- Open Source Uml Modeling Software
- SysML Diagram | SysML | Process Flowchart | Uml Tools Open Source
- Open Source Uml Modeling Tool
- SysML Diagram | SysML | Process Flowchart | Open Source Uml ...
- Open Source Uml Software
- Open Source Process Mapping
- Diagram Software Open Source
- Open Source Uml Diagram
- Uml Diagram Tool Open Source
- Open Source Diagram Editor
- Block Diagram Software Open Source
- Process Flowchart | SysML Diagram | SysML | Open Source Process ...
- Swimlane Diagram Open Source
- Process Flowchart | SysML | SysML Diagram | Open Source Project ...
- Dfd Tools Open Source
- SysML Diagram | Process Flowchart | SysML | Open Source ...
- Open Source Flowchart Tool
- Process Flowchart | SysML | SysML Diagram | Open Source Project ...