HelpDesk
Accounting Information Systems Flowchart Symbols

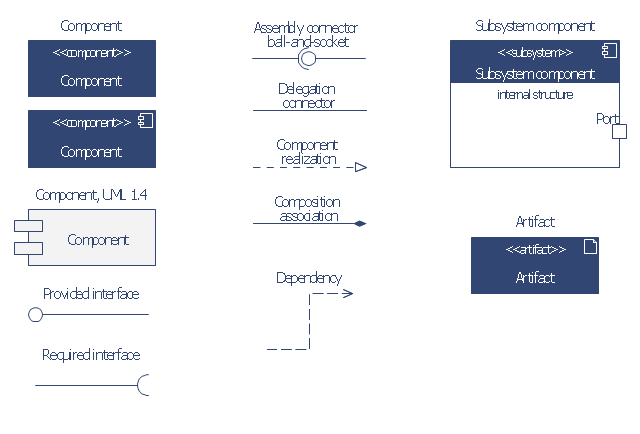
The vector stencils library "Bank UML component diagram" contains 13 shapes for drawing UML component diagrams.
Use it for object-oriented modeling of your bank information system.
"A component is something required to execute a stereotype function. Examples of stereotypes in components include executables, documents, database tables, files, and library files.
Components are wired together by using an assembly connector to connect the required interface of one component with the provided interface of another component. This illustrates the service consumer - service provider relationship between the two components. ...
When using a component diagram to show the internal structure of a component, the provided and required interfaces of the encompassing component can delegate to the corresponding interfaces of the contained components. ...
Symbols.
This may have a visual stereotype in the top right of the rectangle of a small rectangle with two even smaller rectangles jutting out on the left.
The lollipop, a small circle on a stick represents an implemented or provided interface. The socket symbol is a semicircle on a stick that can fit around the lollipop. This socket is a dependency or needed interface." [Component diagram. Wikipedia]
This example of UML component diagram symbols for the ConceptDraw PRO diagramming and vector drawing software is included in the ATM UML Diagrams solution from the Software Development area of ConceptDraw Solution Park.
UML component diagram symbols
 IDEF0 Diagrams
IDEF0 Diagrams visualize system models using the Integration Definition for Function Modeling (IDEF) methodology. Use them for analysis, development and integration of information and software systems, and business process modelling.
 Pyramid Diagrams
Pyramid Diagrams solution extends ConceptDraw PRO software with templates, samples and library of vector stencils for drawing the marketing pyramid diagrams.
HelpDesk
Event-driven Process Chain (EPC) Diagram Software

HelpDesk
How to Create a Data Flow Diagram using ConceptDraw PRO
 example")
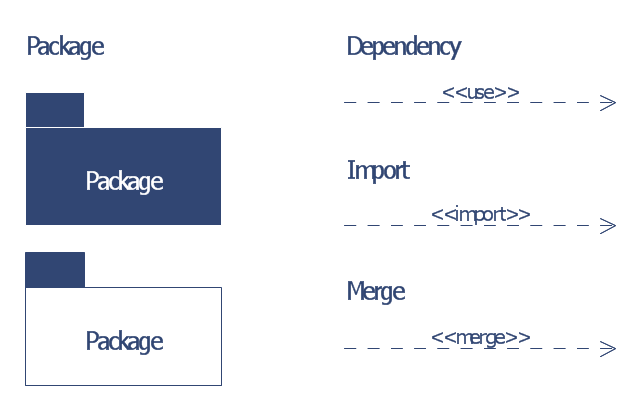
The vector stencils library "Bank UML package diagram" contains 5 shapes for drawing UML package diagrams.
Use it for object-oriented modeling of your bank information system.
"A package diagram in the Unified Modeling Language depicts the dependencies between the packages that make up a model.
In addition to the standard UML Dependency relationship, there are two special types of dependencies defined between packages:
* package import,
* package merge.
Elements.
1. Package: a general purpose mechanism for organizing model elements & diagrams into groups. It provides an encapsulated namespace within which all the names must be unique. It is used to group semantically related elements. It is a namespace as well as an element that can be contained in other packages' namespaces.
2. Class: a representation of an object that reflects its structure and behavior within the system. It is a template from which running instances are created. Classes usually describe the logical structure of the system.
3. Interface: a specification of behavior. An implementation class must be written to support the behavior of an interface class.
4. Object: an instance of a class. It is often used in analysis to represent an artifact or other item.
5. Table: a stereotyped class." [Package diagram. Wikipedia]
This example of UML package diagram symbols for the ConceptDraw PRO diagramming and vector drawing software is included in the ATM UML Diagrams solution from the Software Development area of ConceptDraw Solution Park.
UML package diagram symbols
- Library Information System Use Case Diagram
- Deployment Diagram Of Library Information System
- Sequence Diagrams For Library Information System
- DFD Library System | Data Flow Diagram Symbols. DFD Library ...
- Sample Of Accounting System Using Sequence Diagram
- Activity Diagrams For Library Information Systems
- Uml Use Case Diagram Sample Library System
- Draw A Component Diagram For Library Information System
- Composite Diagram For Library Management System
- UML Diagram | How to Create a Bank ATM Use Case Diagram ...
- Deployment Diagram For Library System
- Element Of Information Systems With Diagram
- DFD Library System | Data Flow Diagrams (DFD) | Process ...
- Data Flow Diagram (DFD) | Context Diagram Template | DFD Library ...
- DFD Library System | Data Flow Diagram Symbols. DFD Library ...
- UML use case diagram - Banking system
- UML Deployment Diagram Example - ATM System | Design ...
- How to Create a Bank ATM Use Case Diagram Using ConceptDraw ...
- UML Diagram | Process Flowchart | Structured Systems Analysis ...
- Draw Data Flow Diagram For Library Management System