ConceptDraw Arrows10 Technology
How should diagramming software work? The answer is - Fast and easy. "Tree"- mode drawing works like that. Just select objects in your drawing and press Tree or Chain button to connect all of them just in one click. Your diagram looks professional and it took only a moment to draw.
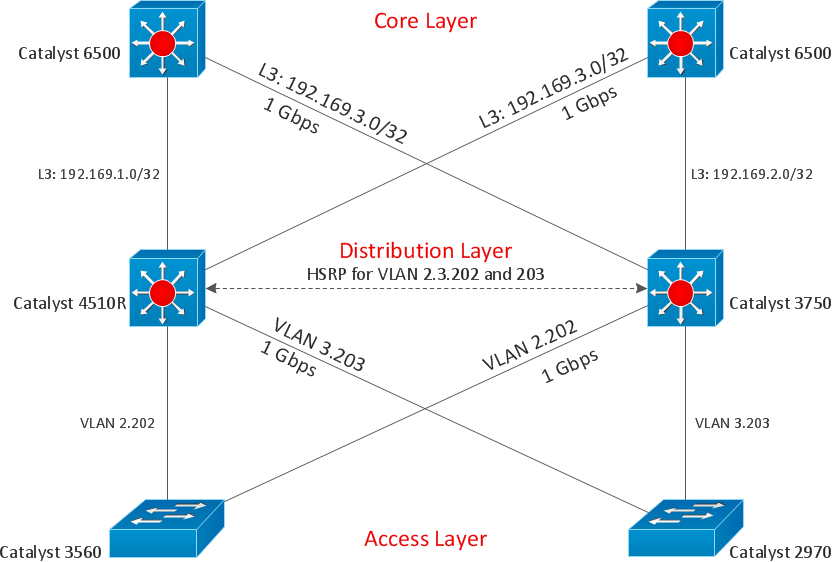
 Cisco Network Diagrams
Cisco Network Diagrams solution extends ConceptDraw PRO software with samples, templates and libraries of vector stencils for drawing the Cisco computer network diagrams.
Draw Diagram on Mac
Professional diagramming software for mac helps you create Cause and Effect diagram known as Fishbone diagram or Ishikawa diagram from ConceptDraw Business Solution. You will be offered to use templates, samples or draw your diagram using ConceptDraw Arrows10 Technology
 Active Directory Diagrams
Active Directory Diagrams solution extends ConceptDraw PRO software with samples, templates and libraries of vector stencils for drawing the AD diagrams to visualize the detail structures of the Microsoft Windows networks.
 Computer Network Diagrams
Computer Network Diagrams solution extends ConceptDraw PRO software with samples, templates and libraries of vector icons and objects of computer network devices and network components to help you create professional-looking Computer Network Diagrams, to plan simple home networks and complex computer network configurations for large buildings, to represent their schemes in a comprehensible graphical view, to document computer networks configurations, to depict the interactions between network's components, the used protocols and topologies, to represent physical and logical network structures, to compare visually different topologies and to depict their combinations, to represent in details the network structure with help of schemes, to study and analyze the network configurations, to communicate effectively to engineers, stakeholders and end-users, to track network working and troubleshoot, if necessary.
- Tree Network Topology Diagram | Network Topologies | Fully ...
- Tree Network Topology Diagram | Star Network Topology | Fully ...
- Tree Network Topology Diagram | Network Topologies | Hybrid ...
- Network Topologies | Hotel Network Topology Diagram | Active ...
- Wireless Network LAN | Wireless Network WLAN | Tree Network ...
- Tree Network Topology Diagram | Fully Connected Network ...
- Hybrid Network Topology | Tree Network Topology Diagram ...
- Tree Network Topology Diagram | Fully Connected Network ...
- Fault Tree Analysis Software | Star Network Topology | Total Quality ...
- How To Create Root Cause Analysis Diagram | Types of Flowcharts ...
- Simple Diagramming | Network Topology | Influence Diagram ...
- Tree Topology Diagram In Business Organization
- Network Topologies | Fully Connected Network Topology Diagram ...
- Hybrid Network Topology | Star Network Topology | Tree Network ...
- Tree Network Topology Diagram | Star Network Topology | Fully ...
- Fault Tree Analysis Diagrams
- Tree Network Topology Diagram | Fault Tree Analysis Diagrams ...
- Bus Network Topology | Hybrid Network Topology | Hotel Network ...
- Diagram Physical Topologies | Network Topologies | Logical ...
- Active Directory Diagram | Tree Network Topology Diagram ...

