 Accounting Flowcharts
Accounting Flowcharts solution extends ConceptDraw PRO software with templates, samples and library of vector stencils for drawing the accounting flow charts.
"Classic TQM Tools ...
Flow Charts Pictures, symbols or text coupled with lines, arrows on lines show direction of flow. Flowcharting enables
modeling of processes; problems/ opportunities and decision points etc. It develops a common understanding of a process by those in
volved." [whaqualitycenter.org/ Portals/ 0/ Tools%20 to%20 Use/ Classic%20 Quality%20 Tools/ Classic%20 TQM%20 Tools%20 R%20 2-12.pdf]
The vector stencils library TQM diagrams contains 58 symbols for drawing total quality management (TQM) flow charts using the ConceptDraw PRO diagramming and vector drawing software.
The example "Design elements - TQM diagram" is included in the Total Quality Management (TQM) Diagrams solution from the Quality area of ConceptDraw Solution Park.
 Fishbone Diagram
Fishbone Diagrams solution extends ConceptDraw PRO software with templates, samples and library of vector stencils for drawing the Ishikawa diagrams for cause and effect analysis.
 Entity-Relationship Diagram (ERD)
Entity-Relationship Diagram (ERD) solution extends ConceptDraw PRO software with templates, samples and libraries of vector stencils from drawing the ER-diagrams by Chen's and crow’s foot notations.
HelpDesk
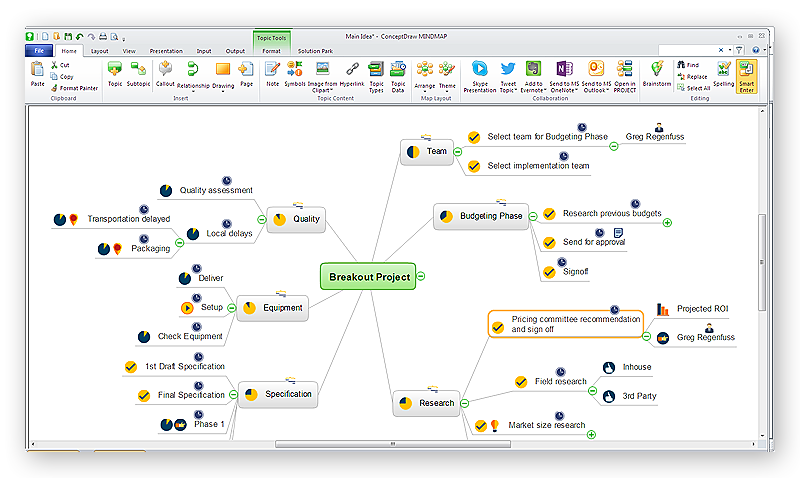
How to Draw a Mind Map on PC Using ConceptDraw MINDMAP
Mind maps are useful forcapturing ideas, organizing and structuring information in a visual form, that is easier to understand, and easier to explain to others. Mind map consists of a general Main Idea surrounded by other related topics and subtopics, which are displayed in a radial hierarchical structure. Read this step-by-step guide on how to create a mind map using ConceptDraw MINDMAP for Windows.
- Flow Chart Diagrams For Solving Transportation Problem
- Transportation Problems Uml Diagrams
- Transportation Problm Process Digram
- Process Flowchart | Preparation for a Trip | Road Transport - Design ...
- Process Flowchart | Bar Diagrams for Problem Solving. Create event ...
- Process Flowchart | Intelligent transportation system | UML Class ...
- Basic Flowchart Symbols and Meaning | Audit Flowchart Symbols ...
- Process Flowchart | Rail transport - Design elements | Buying A Car ...
- Basic Flowchart Symbols and Meaning | Road Transport - Design ...
- Process Flowchart | Road Transport - Design Elements | Watercraft ...
- Entity-Relationship Diagram (ERD) with ConceptDraw PRO ...
- Process Flowchart | Flow chart Example. Warehouse Flowchart ...
- Logistics - Choreography BPMN 2.0 diagram | Process Flowchart ...
- Process Flowchart | Sales Process Flowchart . Flowchart Examples ...
- Transport Management System Data Flow Diagram
- Process Flowchart | Building Drawing Software for Design Site Plan ...
- Transport Management System Project Flow Diagram
- Data Flow Diagrams (DFD) | Aerospace and Transport | Fishbone ...
- Fishbone Examples On Transport

