A four level pyramid model of different types of Information Systems based on the different levels of hierarchy in an organization. The first level represents transaction processing systems for workers. The second level represents management information systems for middle managers. The third level represents decision support systems for senior menegers. The fourth level represents executive information systems for executives.
"The "classic" view of Information systems found in the textbooks in the 1980s was of a pyramid of systems that reflected the hierarchy of the organization, usually transaction processing systems at the bottom of the pyramid, followed by management information systems, decision support systems, and ending with executive information systems at the top. Although the pyramid model remains useful, since it was first formulated a number of new technologies have been developed and new categories of information systems have emerged, some of which no longer fit easily into the original pyramid model.
Some examples of such systems are:
data warehouses,
enterprise resource planning,
enterprise systems,
expert systems,
search engines,
geographic information system,
global information system,
office automation." [Information systems. Wikipedia]
This diagram was redesigned using the ConceptDraw PRO diagramming and vector drawing software from Wikimedia Commons file Four-Level-Pyramid-model.png. [commons.wikimedia.org/ wiki/ File:Four-Level-Pyramid-model.png]
This file is licensed under the Creative Commons Attribution-Share Alike 3.0 Unported license. [creativecommons.org/ licenses/ by-sa/ 3.0/ deed.en]
The triangle chart example "Information systems types" is included in the Pyramid Diagrams solution from the Marketing area of ConceptDraw Solution Park.
Pyramid diagram

The vector stencils library "App icons" contains 24 icons of iOS 8 / iPhone 6 software applications.
Use it to design iOS 8 apps GUI prototypes and iPhone 6 software applications user interface sketches and mockups.
The icons example "App icons - Vector stencils library" was created using the ConceptDraw PRO diagramming and vector drawing software extended with the iPhone User Interface solution from the Software Development area of ConceptDraw Solution Park.
Messages
Calendar
Photos
Camera
Weather
Clock
Maps
Videos
Notes
Reminders
Stocks
Game Center
Newsstand
iTunes Store
App Store
iBooks
Health
Passbook
Passbook (iOS 7)
Settings
Phone
Mail
Music
Safari
This SWOT matrix diagram example was created on the base of article "An Easy Way To Jumpstart Your Strategic Plan: SWOT" by Leslie Wolf from the website of the California Digital Library, the University of California. "Strategic planning doesn’t have to be a daunting and lengthy process. The goal is really a simple one: to help you understand your world and build a road map to guide your efforts. ...
This analysis tool can help you focus your attention on the specific success factors that are right for your team.
The tool is called a SWOT analysis. SWOT stands for Strengths and Weaknesses, Opportunities and Threats. Here’s what it means:
(1) Strengths are those positive internal attributes that strengthen your business or team. You can develop plans to capitalize on those strengths.
(2) Weaknesses are those negative internal attributes that are working against your success. You can shore up those weaknesses so they don’t stop your success.
(3) Opportunities are those external conditions that can have a positive effect on your goals. These opportunities can point you in the right direction.
(4) Threats are those external conditions that can have a negative effect on your goals. These threats will affect you less if you can identify and minimize them. ...
We thought it would be helpful to show you a sample SWOT analysis for a business you can easily visualize: a small independent bookstore in a university town. The store owner brought the team together to think about how the bookstore could survive during the continuing financial downturn. After an hour of brainstorming, this is the SWOT analysis they developed." [cdlib.org/ cdlinfo/ 2010/ 09/ 29/ an-easy-way-to-jumpstart-your-strategic-plan-swot/ ]
The matrix diagram example "SWOT analysis for a small independent bookstore" was created using the ConceptDraw PRO diagramming and vector drawing software extended with the SWOT Analysis solution from the Management area of ConceptDraw Solution Park.
SWOT matrix

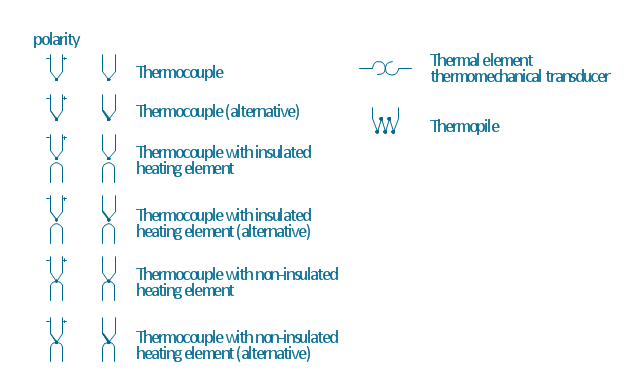
The vector stencils library "Thermo" contains 14 symbols of thermoelectric elements: thermal element, thermocouples with and without heating elements, thermoplile.
Use it for drawing electrical layouts, electronic schematics, and circuit diagrams.
"The thermoelectric effect is the direct conversion of temperature differences to electric voltage and vice versa. A thermoelectric device creates voltage when there is a different temperature on each side. Conversely, when a voltage is applied to it, it creates a temperature difference. At the atomic scale, an applied temperature gradient causes charge carriers in the material to diffuse from the hot side to the cold side.
This effect can be used to generate electricity, measure temperature or change the temperature of objects. Because the direction of heating and cooling is determined by the polarity of the applied voltage, thermoelectric devices can be used as temperature controllers.
The term "thermoelectric effect" encompasses three separately identified effects: the Seebeck effect, Peltier effect, and Thomson effect. Textbooks may refer to it as the Peltier–Seebeck effect. ...
Thermocouples and thermopiles are devices that use the Seebeck effect to measure the temperature difference between two objects, one connected to a voltmeter and the other to the probe. The temperature of the voltmeter, and hence that of the material being measured by the probe, can be measured separately using cold junction compensation techniques." [Thermoelectric effect. Wikipedia]
The shapes example "Design elements - Thermo" was drawn using the ConceptDraw PRO diagramming and vector drawing software extended with the Electrical Engineering solution from the Engineering area of ConceptDraw Solution Park.
Thermoelectric elements
- 4 Level pyramid model diagram - Information systems types ...
- Text Ribbon Png
- Ribbon Design Png
- Ribbon Designs Png
- Vector Worker Png
- Pyramid Diagram | 4 Level pyramid model diagram - Information ...
- Pyramid Diagram | Pyramid Diagram | Process Flowchart | Chart Of ...
- 4 Level pyramid model diagram - Information systems types | How to ...
- 4 Level pyramid model diagram - Information systems types | Basic ...
- Pyramid Diagram | Pyramid Diagram | Knowledge hierarchy triangle ...
- 4 Level pyramid model diagram - Information systems types | Why ...
- Design elements - ER diagram (Chen notation) | Chen Notation ...
- Hierarchical Network Topology | Venn Diagram Examples for ...
- Hierarchy Pyramid
- Pyramid Diagram | Matrix Organization Structure | Pyramid Diagram ...
- App icons - Vector stencils library
- Pyramid Diagram | Data Flow Diagram Symbols. DFD Library ...
- Pyramid Diagram | Pyramid Diagram | Process Flowchart | With The ...
- Types of Flowcharts | UML Diagram Types List | Pyramid Diagram ...
- Metropolitan area networks (MAN). Computer and Network ...