"State machine diagram is a behavior diagram which shows discrete behavior of a part of designed system through finite state transitions. State machine diagrams can also be used to express the usage protocol of part of a system. Two kinds of state machines defined in UML 2.4 are:
(1) behavioral state machine, and
(2) protocol state machine.
The following nodes and edges are typically drawn in state machine diagram: behavioral state, behavioral transition, protocol state, protocol transition, different pseudostates. ...
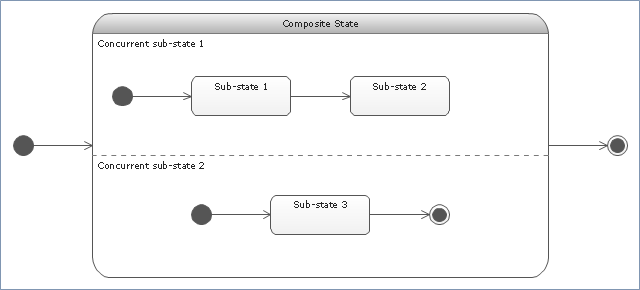
Behavioral state machine is specialization of behavior and is used to specify discrete behavior of a part of designed system through finite state transitions. The state machine formalism used in this case is an object-based variant of Harel statecharts.
Behavior is modeled as a traversal of a graph of state nodes connected with transitions. Transitions are triggered by the dispatching of series of events. During the traversal, the state machine could also execute some activities. ...
Protocol state machine is a specialization of behavioral state machine and is used to express usage protocol or lifecycle of a classifier. It specifies which operations of the classifier can be called in which state and under which condition, thus specifying the allowed call sequences on the classifier’s operations. Protocol state machines express the legal transitions that a classifier can trigger." [uml-diagrams.org/ state-machine-diagrams.html]
The template "UML state machine diagram" for the ConceptDraw PRO diagramming and vector drawing software is included in the Rapid UML solution from the Software Development area of ConceptDraw Solution Park.
www.conceptdraw.com/ solution-park/ software-uml
(1) behavioral state machine, and
(2) protocol state machine.
The following nodes and edges are typically drawn in state machine diagram: behavioral state, behavioral transition, protocol state, protocol transition, different pseudostates. ...
Behavioral state machine is specialization of behavior and is used to specify discrete behavior of a part of designed system through finite state transitions. The state machine formalism used in this case is an object-based variant of Harel statecharts.
Behavior is modeled as a traversal of a graph of state nodes connected with transitions. Transitions are triggered by the dispatching of series of events. During the traversal, the state machine could also execute some activities. ...
Protocol state machine is a specialization of behavioral state machine and is used to express usage protocol or lifecycle of a classifier. It specifies which operations of the classifier can be called in which state and under which condition, thus specifying the allowed call sequences on the classifier’s operations. Protocol state machines express the legal transitions that a classifier can trigger." [uml-diagrams.org/ state-machine-diagrams.html]
The template "UML state machine diagram" for the ConceptDraw PRO diagramming and vector drawing software is included in the Rapid UML solution from the Software Development area of ConceptDraw Solution Park.
www.conceptdraw.com/ solution-park/ software-uml
UML state machine diagram
"Causes in the diagram are often categorized, such as to the 6 M's ...
The 6 Ms (used in manufacturing industry):
(1) Machine (technology);
(2) Method (process);
(3) Material (Includes Raw Material, Consumables and Information.);
(4) Man Power (physical work)/ Mind Power (brain work): Kaizens, Suggestions;
(5) Measurement (Inspection);
(6) Milieu/ Mother Nature (Environment).
The original 6Ms used by the Toyota Production System have been expanded by some to include the following and are referred to as the 8Ms. However, this is not globally recognized. It has been suggested to return to the roots of the tools and to keep the teaching simple while recognizing the original intent; most programs do not address the 8Ms.
(7) Management/ Money Power;
(8) Maintenance." [Ishikawa diagram. Wikipedia]
This 8Ms Ishikawa diagram (manufacturing cause and effect diagram) template is included in the Fishbone Diagram solution from the Management area of ConceptDraw Solution Park.
8Ms Ishikawa diagram

- UML state machine diagram - Template
- UML state machine diagram - Template | How to Use ConceptDraw ...
- UML state machine diagram - Template | UML State Machine ...
- UML state machine diagram - Template | UML state machine ...
- UML state machine diagram - Template | Design elements - Bank ...
- Behavioral Uml Diagrams
- UML package diagram - Template | UML communication diagram ...
- UML state machine diagram - Template
- Manufacturing 8 Ms fishbone diagram - Template | How Do ...
- UML State Machine Diagram .Design Elements | Diagramming ...
- Manufacturing 8 Ms fishbone diagram - Template | 8ms Men Machine
- UML communication diagram - Template | UML deployment diagram ...
- Manufacturing 8 Ms fishbone diagram - Template | Total Quality ...
- 5-Set Venn diagram - Template | Context Diagram Template ...
- Manufacturing 8 Ms fishbone diagram - Template | 8m Method ...
- Manufacturing 8 Ms fishbone diagram - Template | Total Quality ...
- Logic gate diagram - Template | Electrical Symbols, Electrical ...
- Vector stencils library - State machine diagram | State machine ...
- Diagramming Software for Design UML State Machine Diagrams ...
- Industrial Management Men Material Machine Diagram