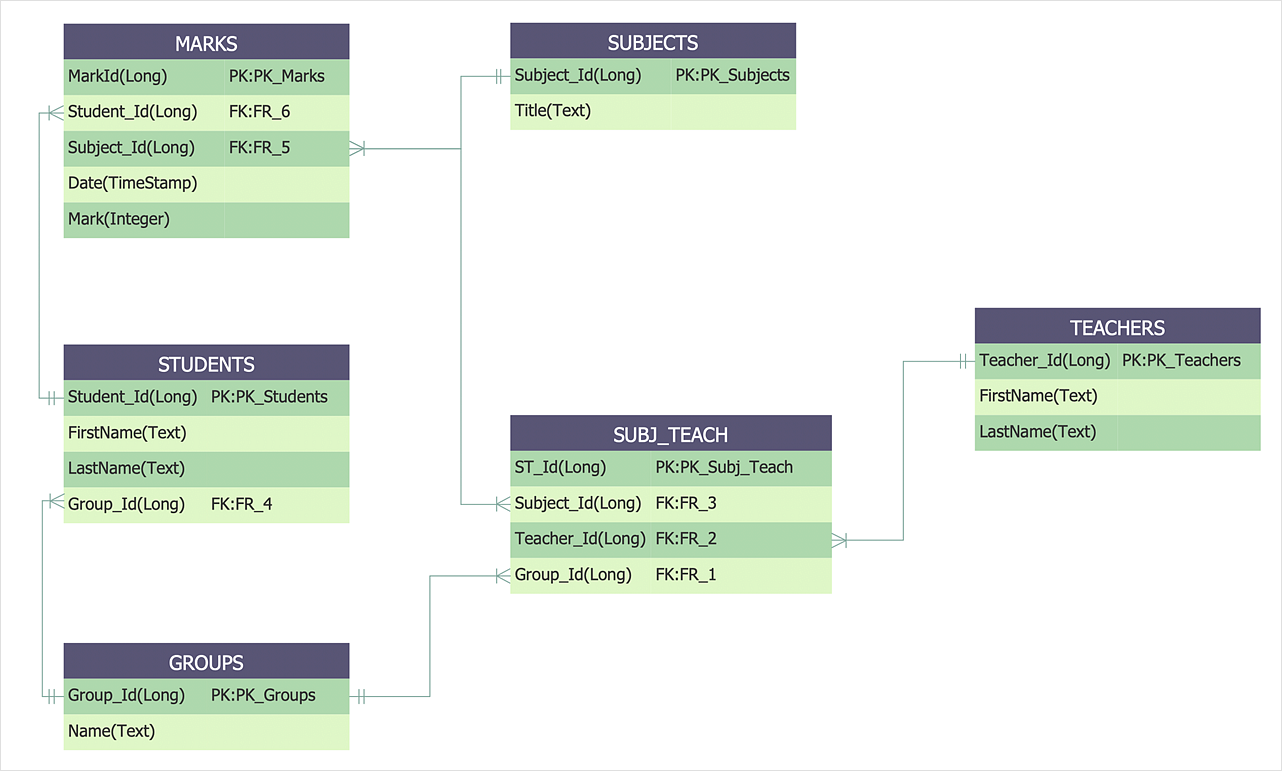
 Entity-Relationship Diagram (ERD)
An Entity-Relationship Diagram (ERD) is a visual presentation of entities and relationships. That type of diagrams is often used in the semi-structured or unstructured data in databases and information systems. At first glance ERD is similar to a flowch
HelpDesk
How to Create an Entity-Relationship Diagram Using ERD Solution
An entity-relationship diagram (ERD)is used in a database modeling process. ERD diagram shows a graphical representation of objects or concepts within an information system and their relationships. The ability to describe a database using the Entity-Relationship model is delivered by the ConceptDraw ERD solution.Software development with ConceptDraw DIAGRAM
Modern software development requires creation of large amount of graphic documentation, these are the diagrams describing the work of applications in various notations and cuts, also GUI design and documentation on project management. ConceptDraw DIAGRAM technical and business graphics application possesses powerful tools for software development and designing technical documentation for object-oriented projects. Solutions included to the Software Development area of ConceptDraw Solution Park provide the specialists with possibility easily and quickly create graphic documentation. They deliver effective help in drawing thanks to the included package of templates, samples, examples, and libraries with numerous ready-to-use vector objects that allow easily design class hierarchies, object hierarchies, visual object-oriented designs, flowcharts, GUI designs, database designs, visualize the data with use of the most popular notations, including the UML and Booch notations, easy manage the development projects, automate projection and development.
 Entity-Relationship Diagram (ERD)
Entity-Relationship Diagram (ERD) solution extends ConceptDraw DIAGRAM software with templates, samples and libraries of vector stencils from drawing the ER-diagrams by Chen's and crow’s foot notations.
"Causes in the diagram are often categorized, such as to the 6 M's ...
The 6 Ms (used in manufacturing industry):
(1) Machine (technology);
(2) Method (process);
(3) Material (Includes Raw Material, Consumables and Information.);
(4) Man Power (physical work)/ Mind Power (brain work): Kaizens, Suggestions;
(5) Measurement (Inspection);
(6) Milieu/ Mother Nature (Environment).
The original 6Ms used by the Toyota Production System have been expanded by some to include the following and are referred to as the 8Ms. However, this is not globally recognized. It has been suggested to return to the roots of the tools and to keep the teaching simple while recognizing the original intent; most programs do not address the 8Ms.
(7) Management/ Money Power;
(8) Maintenance." [Ishikawa diagram. Wikipedia]
This 8Ms Ishikawa diagram (manufacturing cause and effect diagram) template is included in the Fishbone Diagram solution from the Management area of ConceptDraw Solution Park.
- Teacher Student Relation Daygram For Art
- Software Diagrams | Entity-Relationship Diagram (ERD) | School ...
- Entity-Relationship Diagram (ERD) | School and Training Plans ...
- Diagram Of Teacher
- Diagrams Show The Relationship Between Teacher And Students
- Drawing ER diagrams on a Mac | Entity-Relationship Diagram (ERD ...
- Er Diagram For Students And Teachers
- Entity-Relationship Diagram (ERD)
- Data Flow Diagram For Relatoin Between Teachers And Students
- Entity Relationship Diagram Examples | E-R Diagrams | Entity ...
- Software development with ConceptDraw PRO | Software Diagrams ...
- Diagram Creator | Top iPad Business Process Diagrams Apps | Bio ...
- Er Diagram Of Student And Teacher
- Teacher Student Relationship Er Model
- Drawing ER diagrams on a Mac | Entity-Relationship Diagram ...
- Er Diagram Pf Student Teacher
- How To Draw Er Diagram For Student And Teacher Table
- Entity Diagram Between Teacher And Student
- Entity-Relationship Diagram (ERD) | School and Training Plans ...
- Drawing ER diagrams on a Mac | Entity-Relationship Diagram (ERD ...


