This IDEF0 diagram example was redesigned from the Wikimedia Commons file: 6 Decomposition Structure.svg.
[commons.wikimedia.org/ wiki/ File:6_ Decomposition_ Structure.svg]
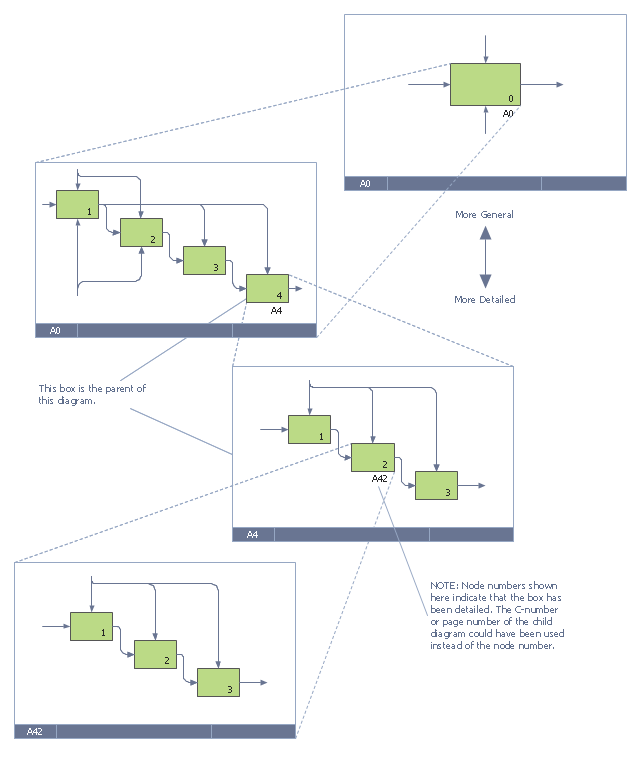
"Functional decomposition refers broadly to the process of resolving a functional relationship into its constituent parts in such a way that the original function can be reconstructed (i.e., recomposed) from those parts by function composition. In general, this process of decomposition is undertaken either for the purpose of gaining insight into the identity of the constituent components (which may reflect individual physical processes of interest, for example), or for the purpose of obtaining a compressed representation of the global function, a task which is feasible only when the constituent processes possess a certain level of modularity (i.e., independence or non-interaction). Interactions between the components are critical to the function of the collection. All interactions may not be observable, but possibly deduced through repetitive perception, synthesis, validation and verification of composite behavior." [Functional decomposition. Wikipedia]
The example "IDEF0 diagram - Decomposition structure" was created using the ConceptDraw PRO diagramming and vector drawing software extended with the solution "IDEF Business Process Diagrams" from the area "Business Processes" of ConceptDraw Solution Park.
[commons.wikimedia.org/ wiki/ File:6_ Decomposition_ Structure.svg]
"Functional decomposition refers broadly to the process of resolving a functional relationship into its constituent parts in such a way that the original function can be reconstructed (i.e., recomposed) from those parts by function composition. In general, this process of decomposition is undertaken either for the purpose of gaining insight into the identity of the constituent components (which may reflect individual physical processes of interest, for example), or for the purpose of obtaining a compressed representation of the global function, a task which is feasible only when the constituent processes possess a certain level of modularity (i.e., independence or non-interaction). Interactions between the components are critical to the function of the collection. All interactions may not be observable, but possibly deduced through repetitive perception, synthesis, validation and verification of composite behavior." [Functional decomposition. Wikipedia]
The example "IDEF0 diagram - Decomposition structure" was created using the ConceptDraw PRO diagramming and vector drawing software extended with the solution "IDEF Business Process Diagrams" from the area "Business Processes" of ConceptDraw Solution Park.
IDEF0 business process diagram
This circular arrows diagram sample shows business process management life cycle.
It was designed on the base of the Wikimedia Commons file: Business Process Management Life-Cycle.svg. [commons.wikimedia.org/ wiki/ File:Business_ Process_ Management_ Life-Cycle.svg]
This file is licensed under the Creative Commons Attribution-Share Alike 3.0 Unported license. [creativecommons.org/ licenses/ by-sa/ 3.0/ deed.en]
"BPM life-cycle.
Business process management activities can be grouped into six categories: vision, design, modeling, execution, monitoring, and optimization.
Functions are designed around the strategic vision and goals of an organization. Each function is attached with a list of processes. Each functional head in an organization is responsible for certain sets of processes made up of tasks which are to be executed and reported as planned. Multiple processes are aggregated to function accomplishments and multiple functions are aggregated to achieve organizational goals." [Business process management. Wikipedia]
The arrow donut chart example "BPM life cycle" was created using the ConceptDraw PRO diagramming and vector drawing software extended with the Circular Arrows Diagrams solution from the area "What is a Diagram" of ConceptDraw Solution Park.
Circular arrows diagram

DroidDia prime
.jpg "droiddia prime")
DroidDia PRO unlocker
.jpg "droiddia pro unlocker")
- Flowchart Svg
- Process Flowchart | UML Sequence Diagram Example. SVG ...
- Flow Chart Symbols Svg
- Audit Flowcharts | Process Flowchart | UML Sequence Diagram ...
- Flowchart Off Page Svg
- UML Sequence Diagram Example. SVG Vectored UML Diagrams ...
- UML Flowchart Symbols | Entity Relationship Diagram Symbols ...
- BPM life cycle | IDEF0 diagram - Tunneled arrows | UML Sequence ...
- IDEF0 diagram - Tunneled arrows | IDEF0 diagram - Detail ...
- Ishikawa fishbone diagram | Pyramid Diagram | San Francisco CA ...
- UML Sequence Diagram Example. SVG Vectored UML Diagrams ...
- UML Sequence Diagram Example. SVG Vectored UML Diagrams ...
- Sequence Diagram Example
- UML Sequence Diagram Example. SVG Vectored UML Diagrams ...
- UML Use Case Diagram Example Registration System | UML ...
- UML Sequence Diagram Example. SVG Vectored UML Diagrams ...
- UML Sequence Diagram | UML Sequence Diagram Example. SVG ...
- UML Sequence Diagram Example. SVG Vectored UML Diagrams ...
- UML Sequence Diagram Example. SVG Vectored UML Diagrams ...
- Article creation process workflows | Pencil Svg