Content Marketing Infographics
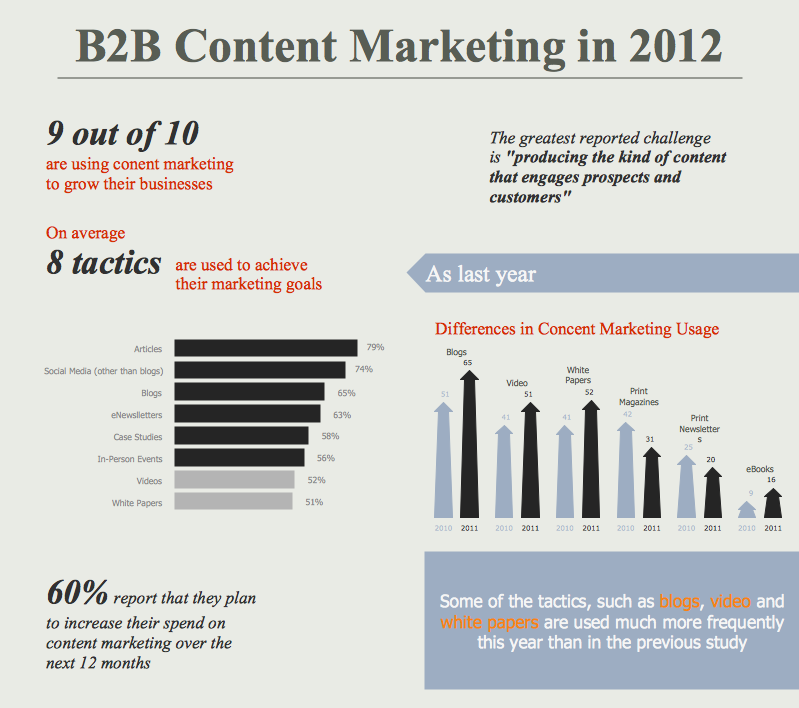
The popularity of visual content marketing grows day by day. So now simple and convenient designing of professional looking Content Marketing Infographics becomes increasingly actual. For achievement this goal ConceptDraw PRO software offers the Marketing Infographics Solution from the Business Infographics Area.Technical Flow Chart
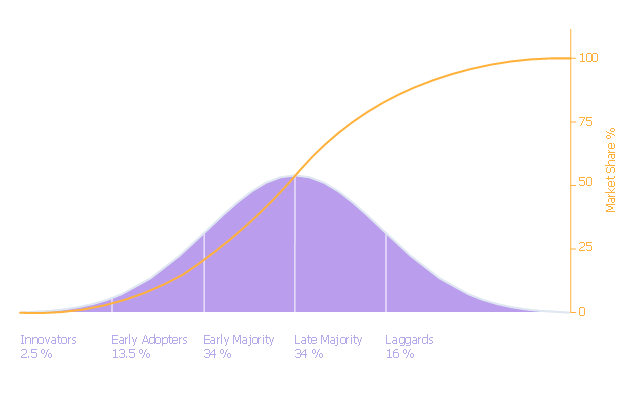
Flow chart is a diagrammatic representation of an algorithm and essential part of planning the system. Flow charts are widely used in technical analysis and programming for easy writing programs and explaining them to others. So, one of the most popular type of flow charts is Technical Flow Chart. Technical Flow Chart can be drawn by pencil on the paper, but it will be easier to use for designing a special software. ConceptDraw PRO diagramming and vector drawing software extended with Flowcharts Solution from the "Diagrams" Area of ConceptDraw Solution Park will be useful for this goal.Diffusion of innovations (DOI) graph illustrates the diffusion of innovations theory.
"Diffusion of innovations is a theory that seeks to explain how, why, and at what rate new ideas and technology spread through cultures. Everett Rogers, a professor of communication studies, popularized the theory in his book Diffusion of Innovations... The book says that diffusion is the process by which an innovation is communicated through certain channels over time among the members of a social system. ... The book espouses the theory that there are four main elements that influence the spread of a new idea: the innovation, communication channels, time, and a social system. This process relies heavily on human capital. The innovation must be widely adopted in order to self-sustain. Within the rate of adoption, there is a point at which an innovation reaches critical mass. The categories of adopters are: innovators, early adopters, early majority, late majority, and laggards ... Diffusion of Innovations manifests itself in different ways in various cultures and fields and is highly subject to the type of adopters and innovation-decision process." [Diffusion of innovations. Wikipedia]
The marketing chart example "Diffusion of innovations graph" was created using the ConceptDraw PRO diagramming and vector drawing software extended with the Marketing Diagrams solution from the Marketing area of ConceptDraw Solution Park.
Cross-Functional Flowchart
Use of Cross-Functional Flowchart is a clear way of showing each team member’s responsibilities and how processes get shared or transferred between different responsible people, teams and departments. Use the best flowchart maker ConceptDraw PRO with a range of standardized cross-functional flowchart symbols to create the Cross-Functional Flowcharts simply and to visualize the relationship between a business process and the functional units responsible for that process. To draw the most quickly Cross-Functional Flowcharts, Cross Functional Process Maps, or Cross Functional Process Flow Diagrams, start with a Cross-functional flowchart samples and templates from ConceptDraw Solution Park. The ConceptDraw Arrows10 and RapidDraw technologies will be also useful for you in drawing. ConceptDraw PRO supports designing both types - horizontal and vertical Cross-functional flowcharts. A vertical layout makes the accents mainly on the functional units while a horizontal layout - on the process. If you need a Visio alternative in Mac OS X, try ConceptDraw PRO. Its interface is very intuitive and it’s actually much easier to use than Visio, yet somehow it’s just as powerful if not more so. ConceptDraw PRO performs professional quality work and seamless Visio interaction.
 Cooking Recipes
Create quick and easy recipe diagrams with the Cooking Recipes solution. Make a tasty meal for dinner, for holidays, or for a party.
- Book Graphic Png
- HR symbols - Vector stencils library | Company's organizational ...
- Professions - Vector stencils library | Exam Preparation Mind Map ...
- Aerospace - Vector stencils library | Ecology pictograms - Vector ...
- Funny transport - Vector illustration | Fairy tales - Vector illustration ...
- Bathroom - Vector stencils library | Flat plumbing plan | Floor Plans ...
- Design elements - Internet | Education pictograms - Vector stencils ...
- AD LDS as a phone book service | Last resort hotel book room ...
- Diffusion of innovations graph | Marketing Diagrams | Marketing ...
- Community Vector Png
- Biology Drawing Software | Professions - Vector stencils library ...
- Animals Png Vector
- Diffusion of innovations graph | Doi Chart
- Chemistry Drawing Software | Biology Drawing | Biology Drawing ...
- Education | Exam Preparation Mind Map | Education pictograms ...
- Animals - Vector stencils library | Design elements - Funny animals ...
- Content marketing cycle - Diamond pie chart | Recycle Diagram
- Biology Drawing Software | Telecommunication networks - Vector ...
- Funny aquatic fauna - Vector stencils library | Funny transport ...
- Cloud clipart - Vector stencils library | Business People Clipart ...


