SWOT Analysis Solution - Strategy Tools

"The name says it: Strength, Weakness, Opportunity, Threat. A SWOT analysis guides you to identify the positives and negatives inside your organization (S-W) and outside of it, in the external environment (O-T). Developing a full awareness of your situation can help with both strategic planning and decision-making.
The SWOT method (which is sometimes called TOWS) was originally developed for business and industry, but it is equally useful in the work of community health and development, education, and even personal growth.
SWOT is not the only assessment technique you can use, but is one with a long track record of effectiveness. The strengths of this method are its simplicity and application to a variety of levels of operation." [ctb.ku.edu/ en/ table-of-contents/ assessment/ assessing-community-needs-and-resources/ swot-analysis/ main]
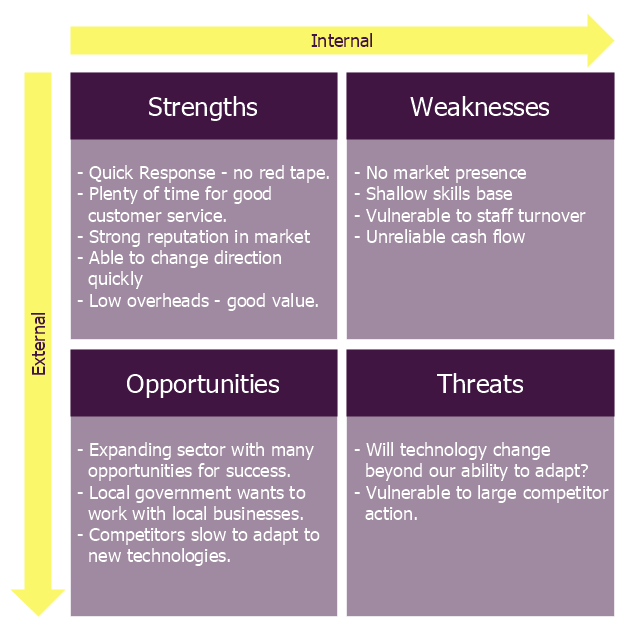
The diagram example "Small business consultancy SWOT analysis matrix" was created using the ConceptDraw PRO diagramming and vector drawing software extended with the SWOT Analysis solution from the Management area of ConceptDraw Solution Park.
The SWOT method (which is sometimes called TOWS) was originally developed for business and industry, but it is equally useful in the work of community health and development, education, and even personal growth.
SWOT is not the only assessment technique you can use, but is one with a long track record of effectiveness. The strengths of this method are its simplicity and application to a variety of levels of operation." [ctb.ku.edu/ en/ table-of-contents/ assessment/ assessing-community-needs-and-resources/ swot-analysis/ main]
The diagram example "Small business consultancy SWOT analysis matrix" was created using the ConceptDraw PRO diagramming and vector drawing software extended with the SWOT Analysis solution from the Management area of ConceptDraw Solution Park.
SWOT matrix
Biology Drawing

Relative Value Chart Software

 Entity-Relationship Diagram (ERD)
An Entity-Relationship Diagram (ERD) is a visual presentation of entities and relationships. That type of diagrams is often used in the semi-structured or unstructured data in databases and information systems. At first glance ERD is similar to a flowch
- Personal Swot Analysis Examples For Students
- Samples Of Students Swot Analysis
- Ppt On Swot Analysis For Students
- Examples Of Swot Analysis For Students
- Threats In Swot Analysis For Students
- What Are Opportunities In Swot Analysis Of Students
- Personal Swot Analysis Of A Student
- How to Create SWOT Analysis Template Using ConceptDraw PRO ...
- Example Of Personal Swot Analysis Of A Student
- SWOT Analysis | Mind Maps for Business - SWOT Analysis | Small ...
- Small business consultancy SWOT analysis matrix | Personal Tows ...
- Examples Of The Student Swot
- Opportunities For Self Swot Analysis Of A Student
- Swot Simple Example Of A Student
- SWOT Analysis Solution - Strategy Tools | Entity-Relationship ...
- SWOT Analysis | SWOT Analysis | How to Make SWOT Analysis in a ...
- SWOT Analysis | Mind Maps for Business - SWOT Analysis | Swot ...
- SWOT Analysis | SWOT and TOWS Matrix Diagrams | SWOT ...
- SWOT and TOWS Matrix Diagrams | Small business consultancy ...
- SWOT Analysis | SWOT analysis for a small independent bookstore ...