Flowchart Software

Accounts Payable Process Flow Chart

Example Basic Flowchart. Flowchart Examples

Draw Flow Chart

Flowchart What is Flowchart

 Economy Infographics
The Economy Infographics solution provides a large collection of vector icon libraries, drawing samples and infographic examples for quick and simple design of the best infographics, illustrations, and presentations about economics, markets, economic policy, business, finances, government and social institutions, production, distribution, and consumption of goods and services, economic diagrams and schemes, economic activities designs, continent and country economic maps, economic presentations, market economy and economic system infographic charts, illustrations in economic articles, reports in mass media, and blog posts in social media. It is a valuable tool for wide range of economists, politicians, managers, marketing experts, business analysts, journalists and bloggers focusing on economy, educators and students studying economics, and many other people to communicate visually the economic information.
 Critical Infrastructure Sectors
Critical Infrastructure Sectors solution for ConceptDraw DIAGRAM software provides a set of examples and vector stencil libraries for designing infographics and diagrams about means for the most efficient protection of critical infrastructure, energy sector, and rapid recovery in the case of disruptions. Illustrate your projects on the prevention of physical, environmental, and cyber threats, development of information technology and detection equipment. Improve your projects in communications, financial services, emergency services, homeland security, cybersecurity to solve critical issues efficiently and decrease the detrimental effects of disruptions on society and citizens. Show the results of testing new technologies and newest equipment for critical infrastructure protection and increasing resilience.
This exploded pie chart sample shows the economic sector weightings. It was designed on the base of the Wikimedia Commons file: Badpie.png [commons.wikimedia.org/ wiki/ File:Badpie.png].
This image is available under the Creative Commons Attribution-ShareAlike 3.0 Unported License [creativecommons.org/ licenses/ by-sa/ 3.0/ ].
"The classical breakdown of all economic sectors follows:
Primary: Involves the retrieval and production of raw materials, such as corn, coal, wood and iron. (A coal miner and a fisherman would be workers in the primary sector.)
Secondary: Involves the transformation of raw or intermediate materials into goods e.g. manufacturing steel into cars, or textiles into clothing. (A builder and a dressmaker would be workers in the secondary sector.)
Tertiary: Involves the supplying of services to consumers and businesses, such as baby-sitting, cinema and banking. (A shopkeeper and an accountant would be workers in the tertiary sector.)
In the 20th century, it began to be argued that traditional tertiary services could be further distinguished from "quaternary" and quinary service sectors." [Economic sector. Wikipedia]
The exploded pie chart example "Economic sector weightings" was created using the ConceptDraw PRO diagramming and vector drawing software extended with the Pie Charts solution of the Graphs and Charts area in ConceptDraw Solution Park.
Exploded pie chart

Organizational Chart

Competitor Analysis

Cross-Functional Flowchart - The easiest way to draw crossfunctional

Hotel Service Process

Lean Six Sigma Diagram Software

Porter's Value Chain

Sales Process FlowchartFlowchart Examples

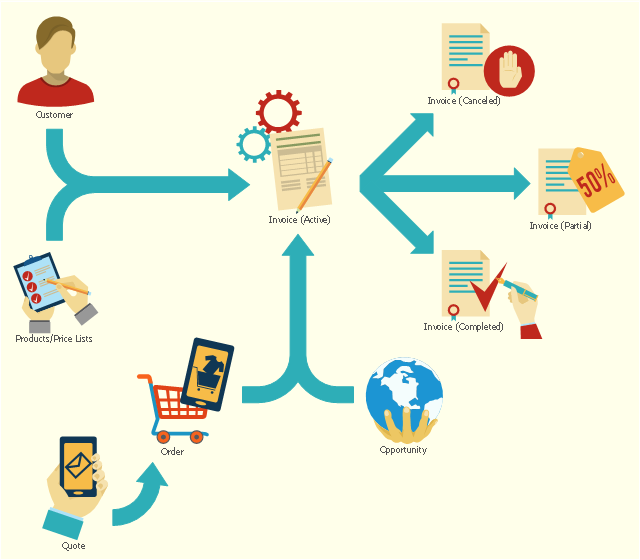
This flowchart example shows the lifecycle of an invoice in Microsoft Dynamics CRM. It was redesigned from the Wikimedia Commons file: Invoice lifecycle.svg. [commons.wikimedia.org/ wiki/ File:Invoice_ lifecycle.svg]
"Microsoft Dynamics CRM is a customer relationship management software package developed by Microsoft. Out of the box, the product focuses mainly on Sales, Marketing, and Service (help desk) sectors...
Dynamics CRM is a server-client application, which, like Microsoft SharePoint, is primarily an IIS-based web application which also supports extensive web services interfaces. Clients access Dynamics CRM either by using a Browser or by a thick client plug-in to Microsoft Outlook." [Microsoft Dynamics CRM. Wikipedia]
The process flowchart example "Invoice lifecycle" was created using the ConceptDraw PRO diagramming and vector drawing software extended with the Sales Flowcharts solution from the Marketing area of ConceptDraw Solution Park.
Lifecycle of an invoice in Microsoft Dynamics CRM
Types of Flowcharts


 Cross-Functional Flowcharts
The Cross-Functional Flowcharts solution extends ConceptDraw DIAGRAM software with cross functional flowchart examples, samples, and libraries of cross functional flow chart vector design elements and CH-1 symbols for easy drawing professional-looking and illustrative Cross Functional Flowchart, Cross Functional Diagram, CH-1 Diagram, Process Flowchart, Deployment Flowchart, Opportunity Flowchart, Swimlane Process Mapping Diagram, or Visio Cross Functional Flowchart for planning and further analyzing, optimizing and improvement processes. The use of included pre-made cross functional flowchart template, opportunity flowchart template, and swimlane process map template, greatly easier designing your Cross-functional flowcharts.
Technical Flow Chart Example

 Fishbone Diagrams
The Fishbone Diagrams solution extends ConceptDraw DIAGRAM software with the ability to easily draw the Fishbone Diagrams (Ishikawa Diagrams) to clearly see the cause and effect analysis and also problem solving. The vector graphic diagrams produced using this solution can be used in whitepapers, presentations, datasheets, posters, and published technical material.
- Cross-functional flowchart landscape, U.S. units | Service Industry ...
- How to Draw the Different Types of Pie Charts | How to Create an ...
- Process Flowchart | Types of Flowcharts | Flow Cart Of Service Sector
- How to Draw the Different Types of Pie Charts | Cross Functional ...
- Process Flowchart | Chart Templates | Flow Chart Of Service Sector
- Provide Many Example Of Service Sector Activities
- Pie Charts | Example Of Service Sector Use Numerical
- Economic sector weightings | Service Sector Examples Chart
- Pie Charts | Seven Basic Tools of Quality | Workflow Diagrams ...