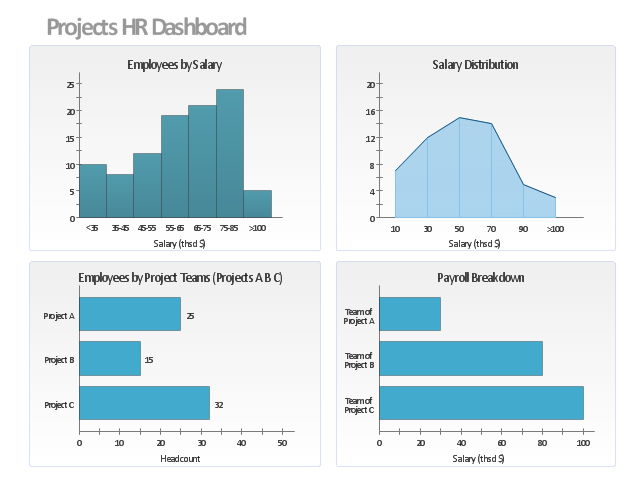
This projects HR dashboard example includes the histogram of employees distribution by salary, the area chart of salari distribution, and two horizontal bar charts: "Employees by Project Teams" and "Payroll Breakdown".
"Project Portfolio Management (PPM) is the centralized management of processes, methods, and technologies used by project managers and project management offices (PMOs) to analyze and collectively manage a group of current or proposed projects based on numerous key characteristics. The objectives of PPM are to determine the optimal resource mix for delivery and to schedule activities to best achieve an organization’s operational and financial goals ― while honouring constraints imposed by customers, strategic objectives, or external real-world factors. ... With PPM, the Office of Finance can improve their accuracy for estimating and managing the financial resources of a project or group of projects. In addition, the value of projects can be demonstrated in relation to the strategic objectives and priorities of the organization through financial controls and to assess progress through earned value and other project financial techniques." [Project portfolio management. Wikipedia]
The example "Projects HR dashboard" was created using the ConceptDraw PRO diagramming and vector drawing software extended with the Frequency Distribution Dashboard solution from the area "What is a Dashboard" of ConceptDraw Solution Park.
 Fishbone Diagrams
The Fishbone Diagrams solution extends ConceptDraw PRO v10 software with the ability to easily draw the Fishbone Diagrams (Ishikawa Diagrams) to clearly see the cause and effect analysis and also problem solving. The vector graphic diagrams produced using this solution can be used in whitepapers, presentations, datasheets, posters, and published technical material.
- Project Portfolio Dashboard Excel
- Fishbone Diagrams | Project Portfolio Dashboard Infographics
- Portfolio Dashboard
- Program Portfolio Dashboard
- Project Portfolio Management Software
- Project Portfolio Management Template Excel
- Employee distribution - HR dashboard | Projects HR dashboard ...
- HR dashboard | Projects HR dashboard | Employee distribution - HR ...
- Gant Chart in Project Management | Projects HR dashboard | How to ...
- Employee distribution - HR dashboard | Projects HR dashboard | HR ...
- Website KPIs - Visual dashboard | Projects HR dashboard | PM ...
- Projects HR dashboard | Cross-Functional Flowcharts | HR ...
- Projects HR dashboard | Competitor Analysis | Project Management ...
- Projects HR dashboard | Enterprise dashboard | HR Flowcharts ...
- Construction Project Chart Examples | PM Dashboards | Best Tool ...
- PM Dashboards | How to Create Project Dashboard on Mac | How to ...
- Employee distribution - HR dashboard | Frequency Distribution ...
- Projects HR dashboard | Employee distribution - HR dashboard ...
- Frequency Distribution Dashboard | Design elements - Frequency ...
- Employee distribution - HR dashboard | HR dashboard | Projects HR ...
