HelpDesk
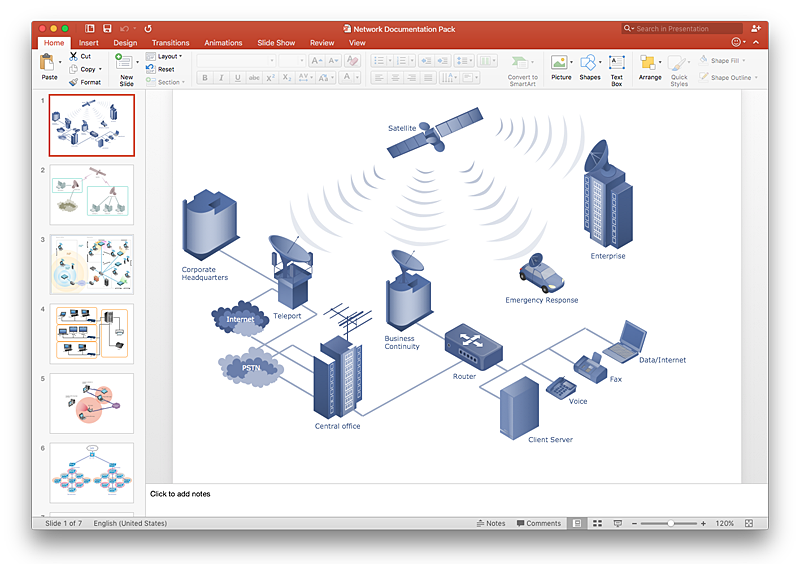
How to Add a Telecommunication Network Diagram to a PowerPoint Presentation Using ConceptDraw PRO
Telecommunication network diagram represents a system consisting of computers, servers, telecommunication devices, switches, satellites, wireless transmitters, antennas, cables, etc., that link a set of remote nodes. It is also describes a telephone exchange, that connects calls between landlines. ConceptDraw PRO allows you to easily create telecommunication network diagrams and then make a PowerPoint Presentation from your network documentation in a few clicks. Telecommunication network diagrams are used to show components and connections in a telecommunications network: how they are interacted between each other and with end-users. The PowerPoint presentation on concept of telecom network can be very informative and helpful. ConceptDraw PRO allows you to make a MS PowerPoint Presentation from your telecommunication network diagrams in a few clicks.
 Active Directory Diagrams
Active Directory Diagrams solution extends ConceptDraw PRO software with samples, templates and libraries of vector stencils for drawing the AD diagrams to visualize the detail structures of the Microsoft Windows networks.
HelpDesk
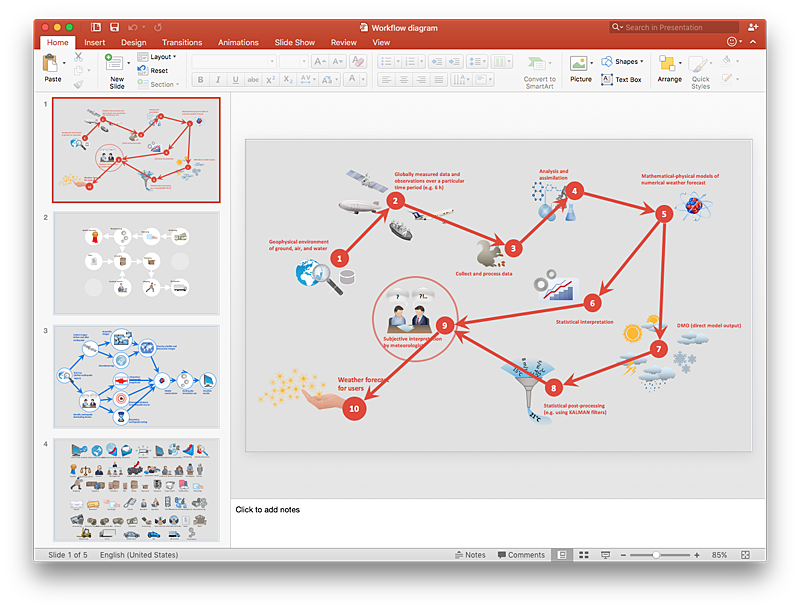
How to Add a Workflow Diagram to a PowerPoint Presentation Using ConceptDraw PRO
Making workflow diagrams in PowerPoint can help to describe the process within your organization as well as making comprehensive analysis presentations for sales or management and also can be used in other presentations and business documentation.HelpDesk
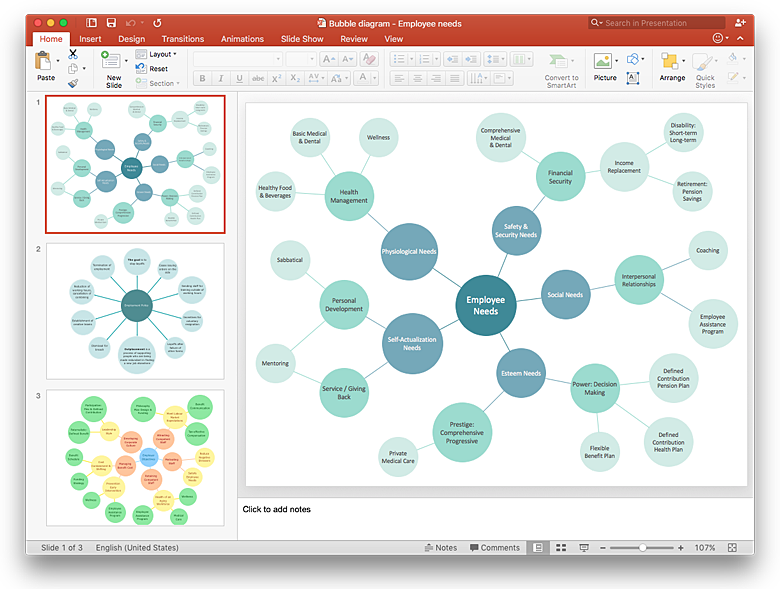
How to Add a Bubble Diagram to a PowerPoint Presentation Using ConceptDraw PRO
Bubble diagrams can be used to compare concepts, and identify areas of similarity and difference. ConceptDraw PRO allows you to make a MS PowerPoint Presentation from your charts in a few simple steps.- How to Add a Workflow Diagram to a PowerPoint Presentation ...
- Fishbone Diagram Ppt Free Download
- Fishbone Diagram Template Powerpoint Free
- How to Add a Workflow Diagram to a PowerPoint Presentation ...
- Business Process Mapping | Free Sipoc Diagram Template For ...
- Circle Arrow Diagram Powerpoint Free
- Business Process Mapping | Free Sipoc Diagram Templates For ...
- Free Dashboard Templates Powerpoint
- Powerpoint Sequence Diagram Template
- How to Add a Bubble Diagram to a PowerPoint Presentation Using ...
- Chart Templates For Powerpoint
- Free Powerpoint Graphs
- Workflow Diagrams | Aerospace and Transport | Presentation Clipart ...
- How To Do A Mind Map In PowerPoint | Professional & Powerful ...
- Powerpoint Charts Free Download
- Ppt Online Education System Uml Diagram
- Fishbone Diagram Template Powerpoint
- SWOT Analysis Tool for Small Business | SWOT Analysis | How to ...
- Free Swot Template Powerpoint For Mac
- How To Get Business Brainstorm On Powerpoint Mac


