 Event-driven Process Chain Diagrams
Event-driven Process Chain (EPC) Diagram is a type of flowchart widely used for modeling in business engineering and reengineering, business process improvement, and analysis. EPC method was developed within the Architecture of Integrated Information Systems (ARIS) framework.
 Business Process Workflow Diagrams
The Business Process Workflow Diagrams solution enhances the ConceptDraw PRO v10 functionality with predesigned examples, samples and a numerous collection of predesigned vector objects of workflow chart elements, icons, arrows, connectors, and varied wor
HelpDesk
How to Use a Cross - Functional Flowcharts Solution
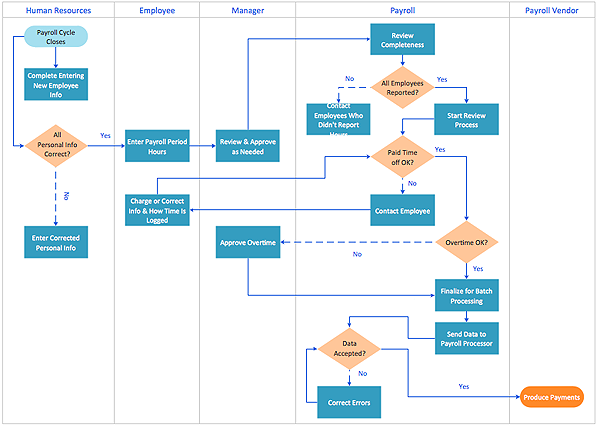
Cross-functional process is a process that involves multiple divisions, each of which makes its part of the entire company workflow. For example: product development, lead management , client orders processing – and other critical processes. Using a Cross-Functional flowchart is a clear way of showing each team member’s responsibilities and how processes get shared or transferred between different teams and departments.The Cross-Functional flowchart is a clear way to visualize the document flow in your organization. The ability to create Cross-functional diagrams is provided by the Cross-Functional Flowcharts solution.
 Entity-Relationship Diagram (ERD)
Entity-Relationship Diagram (ERD) solution extends ConceptDraw PRO software with templates, samples and libraries of vector stencils from drawing the ER-diagrams by Chen's and crow’s foot notations.
 Entity-Relationship Diagram (ERD)
An Entity-Relationship Diagram (ERD) is a visual presentation of entities and relationships. That type of diagrams is often used in the semi-structured or unstructured data in databases and information systems. At first glance ERD is similar to a flowch
 AWS Architecture Diagrams
The flexible AWS cloud solutions will help you to create reliable applications with a high level of scaling in the AWS cloud, to run your applications and accelerate their work on the level of security. Besides AWS resources are available worldwide and yo
 Office Layout Plans
Office layouts and office plans are a special category of building plans and are often an obligatory requirement for precise and correct construction, design and exploitation office premises and business buildings. Designers and architects strive to make office plans and office floor plans simple and accurate, but at the same time unique, elegant, creative, and even extraordinary to easily increase the effectiveness of the work while attracting a large number of clients.
 Fishbone Diagram
Fishbone Diagrams solution extends ConceptDraw PRO software with templates, samples and library of vector stencils for drawing the Ishikawa diagrams for cause and effect analysis.
- Presentation Of Data And Information Of Partnership Firm Process
- Presentation Of Data And Information Of Partnership Firm Process
- Analysis On Partnership Firm
- Presentation Of The Data Of Partnership Firm
- Presentation Of Partnership Firm Process And Procedure
- Partnership Firm Is An Process And Producer Of Analysis Of Data
- Presentation Of Data And Information Of Partnerships Firms
- Presentation Of Data And Information Of Partnership Firm And ...
- Analysis Of Data Partnership Firm
- Analysis Partnership Firm Process And Producers
- Partnership Firm Process Presentation Of The Data Information
- Partnership Firm Process N Procedure Project Presentation N Data ...
- Presentation Of Daymta And Imformation Of Partnership Firm
- Partnership Firm Presentation Of Data And Information
- Chart Procedure Of Partnership Firm
- Partnership Firm Process And Procedure Pdf
- Audit Process Flowchart. Audit Flowchart | Audit Steps | Internal ...
- Partnership Firm Process And Procedure Detailed Report Of Project
- How to Create a HR Process Flowchart Using ConceptDraw PRO ...
