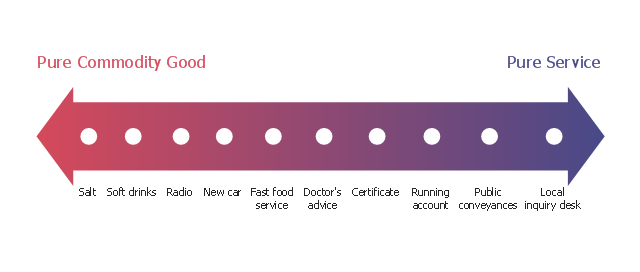
This marketing diagram sample depicts service-goods continuum.
"The dichotomy between physical goods and intangible services is an oversimplification; these are not discrete categories. Most business theorists see a continuum with pure service at one endpoint and pure commodity goods at the other endpoint. Most products fall between these two extremes. Goods are normally structural and can be transferred in an instant while services are delivered over a period of time. Goods can be returned while a service once delivered cannot. Goods are not always tangible and may be virtual." [Goods and services. Wikipedia]
The marketing chart example "Service-goods continuum diagram" was created using the ConceptDraw PRO diagramming and vector drawing software extended with the Marketing Diagrams solution from the Marketing area of ConceptDraw Solution Park.
Marketing chart
Business diagrams & Org Charts with ConceptDraw DIAGRAM


 AWS Architecture Diagrams
AWS Architecture Diagrams with powerful drawing tools and numerous predesigned Amazon icons and AWS simple icons is the best for creation the AWS Architecture Diagrams, describing the use of Amazon Web Services or Amazon Cloud Services, their application for development and implementation the systems running on the AWS infrastructure. The multifarious samples give you the good understanding of AWS platform, its structure, services, resources and features, wide opportunities, advantages and benefits from their use; solution’s templates are essential and helpful when designing, description and implementing the AWS infrastructure-based systems. Use them in technical documentation, advertising and marketing materials, in specifications, presentation slides, whitepapers, datasheets, posters, etc.
- Service Marketing Diagram
- Marketing Diagrams | Flow chart Example. Warehouse Flowchart ...
- With The Aid Of The Diagram Explain The Four Types Of Service
- Flowchart Marketing Process. Flowchart Examples | Flowchart ...
- Services Marketing In Diagram
- Explain The Various Marketing Services With The Aid Of Diagram
- With The Aid Of Diagram Explain Various Marketing Services
- Meaning Of Services Marketing Wikipediath Diagram
- Fishbone Diagram Example For Service Industry
- With The Aid Of A Diagram Explain Service Marketing
- Service -goods continuum diagram | Define Pure Service And ...
- With The Aid Of The Diagram Explain Types Of Service Marketing
- Marketing Specific Service Diagram
- With The Aid Of A Diagram Explain The 4 Types Of Service Marketing
- Explain The Four Types Of Service Marketing With The Aid Of A
- Three Areas That Service Marketing Can Be Applied
- With Aim Of A Diagram Explain Service Marketing
- Diagram Tepresentation Of Service Marketing Mix
- Flowchart Marketing Process. Flowchart Examples | Flowchart ...
- Diagram To Define Marketing