HelpDesk
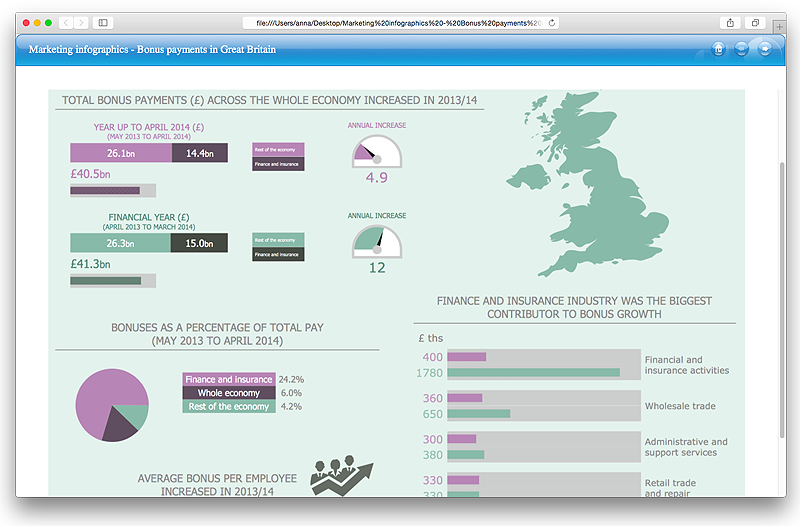
How to Make a Web Page from Infographics
Create your own original marketing illustrations and infographics, presentation slides, website, and blog pages using ConceptDraw PRO.HelpDesk
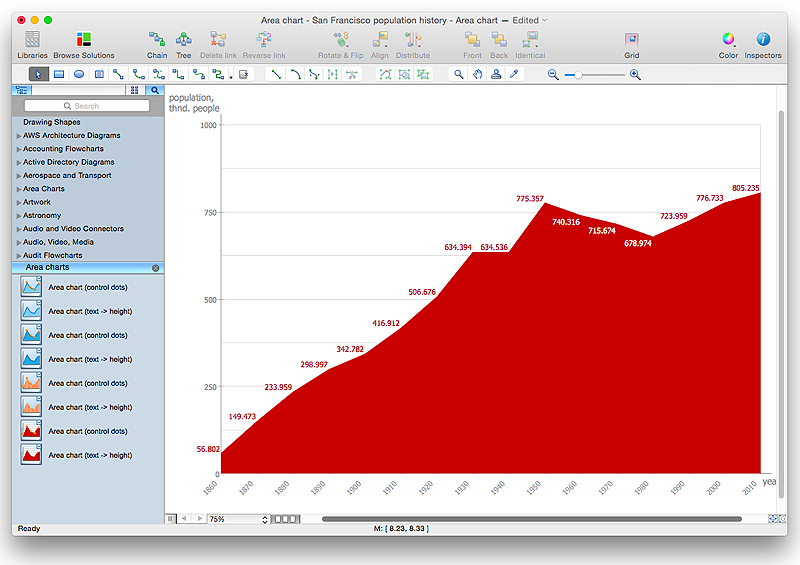
How to Draw an Area Chart in ConceptDraw PRO
Area chart is similar to a line chart, but an area chart has an area, commonly filled with color below the line. The applying of Line charts and area charts are also very similar. They both show continuity across a data set. They are both can be used for displaying time series data and for depicting tendencies better than separate values, but they have some different characteristics. Using the proper one is good chance to show once again a professionalism of your graphic documents. An area chart depicts a colored area below the line. The sum on the vertical axis of an area chart represents the entire value, while the height of each separate piece shows its parts. Area charts are used to display multiple data series with proportion to a whole value , or for separate data series showing a set of countable values, or cumulative data.
 Sport Field Plans
Construction of sport complex, playgrounds, sport school, sport grounds and fields assumes creation clear plans, layouts, or sketches. In many cases you need represent on the plan multitude of details, including dimensions, placement of bleachers, lighting, considering important sport aspects and other special things.
HelpDesk
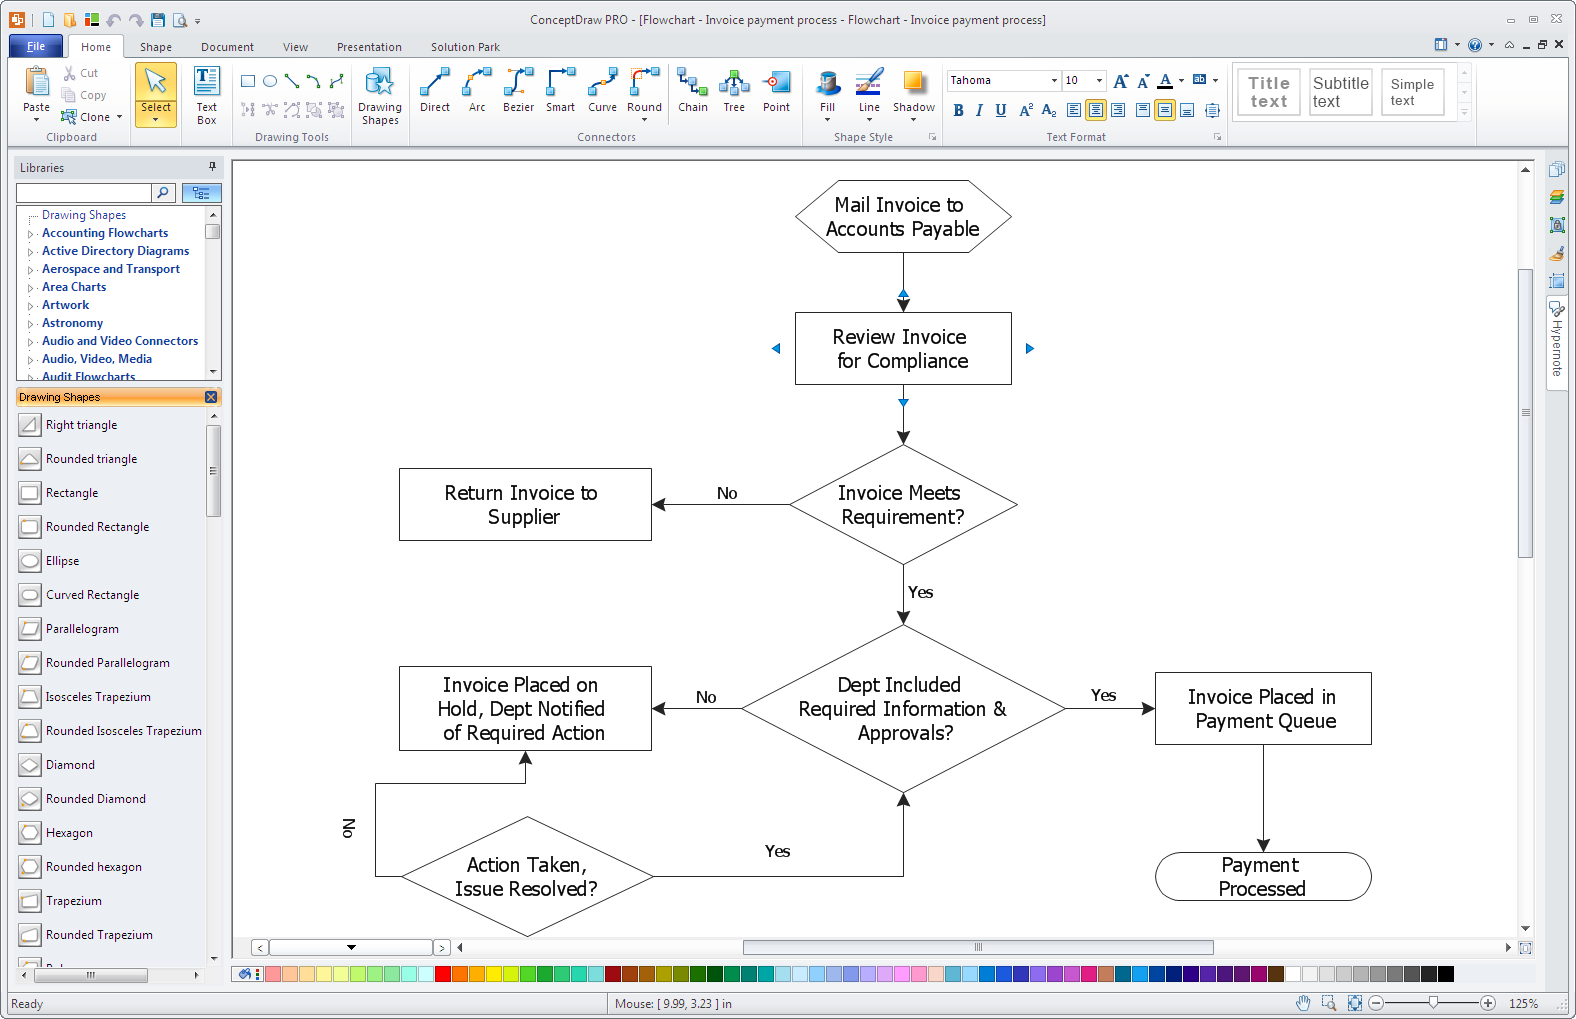
How to Simplify Flow Charting in ConceptDraw PRO on Windows
Flowcharts are a best tool for staking out a huge and complex process into some small readable parts. The use of standard symbols that make it clear for a wide audience makes a software tool preferred for this task. The core for a successful flowchart is its simplicity. That is why often before beginning making flowchart through software, people draw the scetch on a piece of paper. Designing an effective flowchart means the combination of the data needed to be shown and the simplicity with which you depict it. In ConceptDraw PRO it really is sp simple to draw even the most complex flowcharts. Use the RapidDraw technology for the best results.HelpDesk
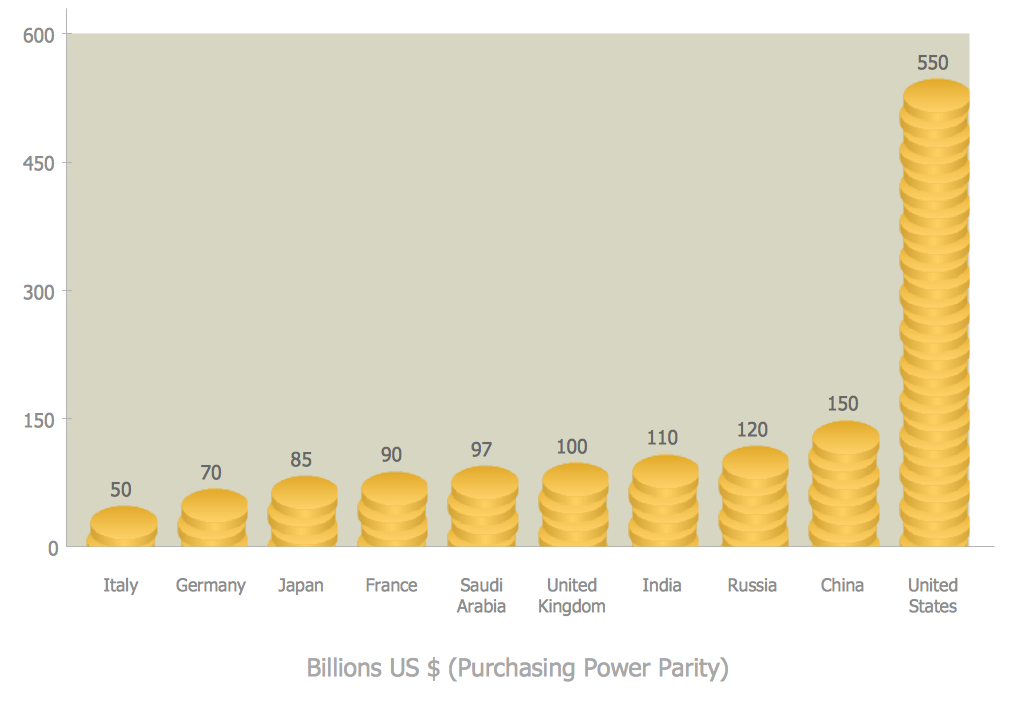
How to Create a Picture Graph in ConceptDraw PRO
Picture Graphs are used commonly to represent non-complex data to a large audience. A Picture Graph is simple kind of marketing diagram used to show the relationship among various quantities. It include pictures or symbols to represent information visually. There are many cases when you have just some numbers to show and compare. This is not a reason to not use visual tools. You can produce a simple picture graph using memorable symbols to get the best visual presentation. Using specific symbols instead of regular colored bars makes picture graphs a much more descriptive tool. You can use tools from an existing library or find appropriate clipart in ConceptDraw’s collection. ConceptDraw PRO allows you to draw a simple and easy to understand Graph Charts using the special library.
 Cafe and Restaurant Floor Plans
Restaurants and cafes are popular places for recreation, relaxation, and are the scene for many impressions and memories, so their construction and design requires special attention. Restaurants must to be projected and constructed to be comfortable and e
- Flow Chart for Olympic Sports | Flow Chart Design - How to Design a ...
- Flow Chart for Olympic Sports | Building Drawing Software for ...
- Flow Chart for Olympic Sports | Winter Sports | How to Make a Web ...
- Flow Chart for Olympic Sports | Contoh Flowchart | Process ...
- Flow Chart for Olympic Sports | Basic Flowchart Symbols and ...
- Flow Chart for Olympic Sports | Selection sorting method - Algorithm ...
- Flow Chart for Olympic Sports | Flow Chart Design - How to Design a ...
- Flow Chart for Olympic Sports | Flow Chart Design - How to Design a ...
- Process Flowchart | Flow Chart Design - How to Design a Good ...
- Flow Chart for Olympic Sports | Selection sorting method - Algorithm ...
- Flow Chart Design - How to Design a Good Flowchart | Flow Chart ...
- Process Flowchart | Flow Chart Design - How to Design a Good ...
- Draw The Sports Symbols For Chart
- Diagram Flow Chart | Process Flowchart | Flowchart Program Mac ...
- Sports Seating Chart Maker Free
- Basketball Court Dimensions | Interior Design Sport Fields - Design ...
- Selection sorting method - Algorithm flowchart | Algorithm flowchart ...
- Biology Short And Simple Flow Chart
- Basic Diagramming | Sport Field Plans | Telecommunication ...
- Flow Chart for Olympic Sports | Selection sorting method - Algorithm ...


