HelpDesk
How to Customize the Columns in Your Project File

 Basic Bar Graphs
This solution enhances ConceptDraw PRO v10.3.0 (or later) with templates, samples and a library of vector stencils for drawing Bar Graphs.
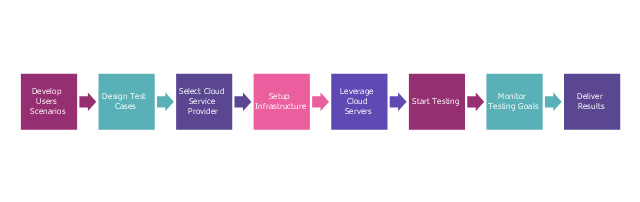
This step diagram example was redesigned from the Wikimedia Commons file: Cloud Testing steps.png. [commons.wikimedia.org/ wiki/ File:Cloud_ Testing_ steps.png]
This file is licensed under the Creative Commons Attribution-Share Alike 3.0 Unported license. [creativecommons.org/ licenses/ by-sa/ 3.0/ deed.en]
"Cloud testing is a form of software testing in which web applications use cloud computing environments (a "cloud") to simulate real-world user traffic. ...
Cloud Testing uses cloud infrastructure for software testing. Organizations pursuing testing in general and load, performance testing and production service monitoring in particular are challenged by several problems like limited test budget, meeting deadlines, high costs per test, large number of test cases, and little or no reuse of tests and geographical distribution of users add to the challenges. Moreover ensuring high quality service delivery and avoiding outages requires testing in one's datacenter, outside the data-center, or both. Cloud Testing is the solution to all these problems. Effective unlimited storage, quick availability of the infrastructure with scalability, flexibility and availability of distributed testing environment reduce the execution time of testing of large applications and lead to cost-effective solutions." [Cloud testing. Wikipedia]
The step chart example "Cloud testing steps" was created using the ConceptDraw PRO diagramming and vector drawing software extended with the Marketing Diagrams solution from the Marketing area of ConceptDraw Solution Park.
www.conceptdraw.com/ solution-park/ marketing-diagrams
Step chart
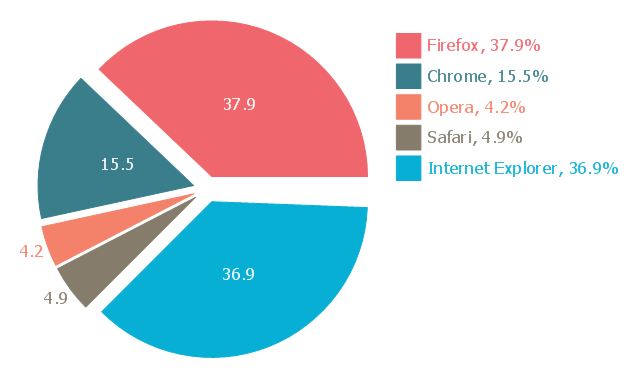
This exploded pie chart sample shows the Europe browser usage share in January 2011. It was designed on the base of the Wikimedia Commons file: 2011 01 Europe Browser share crop.png.
[commons.wikimedia.org/ wiki/ File:2011_ 01_ Europe_ Browser_ share_ crop.png]
This file is licensed under the Creative Commons Attribution 3.0 Unported license. [creativecommons.org/ licenses/ by/ 3.0/ deed.en]
"A chart with one or more sectors separated from the rest of the disk is known as an exploded pie chart. This effect is used to either highlight a sector, or to highlight smaller segments of the chart with small proportions." [Pie chart. Wikipedia]
The exploded pie chart example "Europe browser usage share" was created using the ConceptDraw PRO diagramming and vector drawing software extended with the Pie Charts solution of the Graphs and Charts area in ConceptDraw Solution Park.
Exploded pie chart
This exploded pie chart sample shows the economic sector weightings. It was designed on the base of the Wikimedia Commons file: Badpie.png [commons.wikimedia.org/ wiki/ File:Badpie.png].
This image is available under the Creative Commons Attribution-ShareAlike 3.0 Unported License [creativecommons.org/ licenses/ by-sa/ 3.0/ ].
"The classical breakdown of all economic sectors follows:
Primary: Involves the retrieval and production of raw materials, such as corn, coal, wood and iron. (A coal miner and a fisherman would be workers in the primary sector.)
Secondary: Involves the transformation of raw or intermediate materials into goods e.g. manufacturing steel into cars, or textiles into clothing. (A builder and a dressmaker would be workers in the secondary sector.)
Tertiary: Involves the supplying of services to consumers and businesses, such as baby-sitting, cinema and banking. (A shopkeeper and an accountant would be workers in the tertiary sector.)
In the 20th century, it began to be argued that traditional tertiary services could be further distinguished from "quaternary" and quinary service sectors." [Economic sector. Wikipedia]
The exploded pie chart example "Economic sector weightings" was created using the ConceptDraw PRO diagramming and vector drawing software extended with the Pie Charts solution of the Graphs and Charts area in ConceptDraw Solution Park.
Exploded pie chart

This cycle process chart was redesigned from the Wikimedia Commons file: Business Feedback Loop PNG version.png.
"A business ideally is continually seeking feedback from customers: are the products helpful? are their needs being met? Constructive criticism helps marketers adjust offerings to meet customer needs."
[commons.wikimedia.org/ wiki/ File:Business_ Feedback_ Loop_ PNG_ version.png]
The cycle process diagram example "Business feedback loop" was created using the ConceptDraw PRO diagramming and vector drawing software extended with the Sales Flowcharts solution from the Marketing area of ConceptDraw Solution Park.
Customers feedback cycle process chart

- Graph Logo Png
- Dna Logo Design Png
- Logo Diamond Png
- Work Logo Png
- Investment Logo Png Vector
- Money Received Logo Png
- Logo Of Communication Png
- Cloud Logo Png
- Astronomy Education Design Logo Png Vector
- Landscape & Garden | Growth Roads Logo
- Growth Chart Png
- Logo Plan Project Png
- Scrum Manager Logo Png
- Horizontal Bar Chart Png
- My Logo Example Png
- Bar Chart Examples | Chart Templates | Chart Examples | Horizontal ...
- Problem Solving Logo Png
- Logo Pc Desktop Png
- Internet Circle Logo Blue Png
- Pyramid Chart Examples | Australia Map | Fully Connected Network ...