 Logistics Flow Charts
Logistics Flow Charts solution extends ConceptDraw PRO v11 functionality with opportunities of powerful logistics management software. It provides large collection of predesigned vector logistic symbols, pictograms, objects and clipart to help you design with pleasure Logistics flow chart, Logistics process flow diagram, Inventory flow chart, Warehouse flowchart, Warehouse management flow chart, Inventory control flowchart, or any other Logistics diagram. Use this solution for logistics planning, to reflect logistics activities and processes of an enterprise or firm, to depict the company's supply chains, to demonstrate the ways of enhancing the economic stability on the market, to realize logistics reforms and effective products' promotion.
HelpDesk
How to Make a Logistics Flow Chart

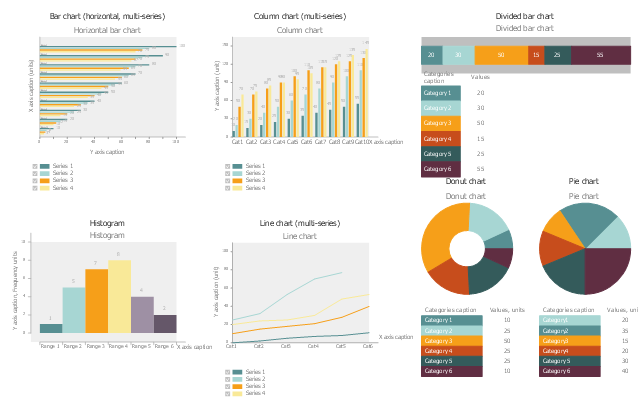
The vector stencil library "Logistic charts" contains 7 graphs: horizontal bar graphs, column chart, divided bar chart, donut chart, histogram, line graph, pie chart.
Use it to design your logistic dashboards with ConceptDraw PRO software.
The graphs example "Design elements - Logistic charts" is included in Logistic Dashboard solution from Business Processes area of ConceptDraw Solution Park.
Use it to design your logistic dashboards with ConceptDraw PRO software.
The graphs example "Design elements - Logistic charts" is included in Logistic Dashboard solution from Business Processes area of ConceptDraw Solution Park.
Graphs
 Logistic Dashboard
The powerful tools of Logistic Dashboard solution and specially developed live graphic objects of logistic icons, logistic navigation elements, logistic indicators, logistic charts and logistic maps effectively assist in designing Logistic dashboards, Logistic maps, Logistic charts, diagrams and infographics. The included set of prebuilt samples and quick-start templates, demonstrates the power of ConceptDraw PRO software in logistics management, its assisting abilities in development, realization and analyzing the logistic processes, as well as in perfection the methods of logistics management.
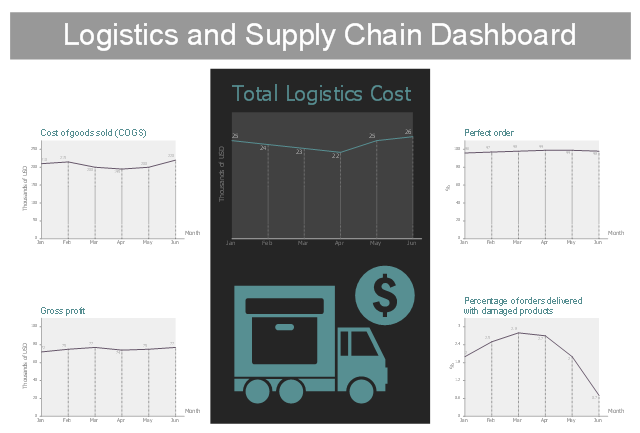
This business dashboard template contains 5 line charts of logistics and supply chain business metrics.
Use it to create your logistic and supply chain dashboard with ConceptDraw PRO software.
The performance dashboard template "Logistics and Supply Chain Dashboard" is included in Logistic Dashboard solution from Business Processes area of ConceptDraw Solution Park.
Use it to create your logistic and supply chain dashboard with ConceptDraw PRO software.
The performance dashboard template "Logistics and Supply Chain Dashboard" is included in Logistic Dashboard solution from Business Processes area of ConceptDraw Solution Park.
Logistic dashboard
HelpDesk
How to Make a Logistic Dashboard

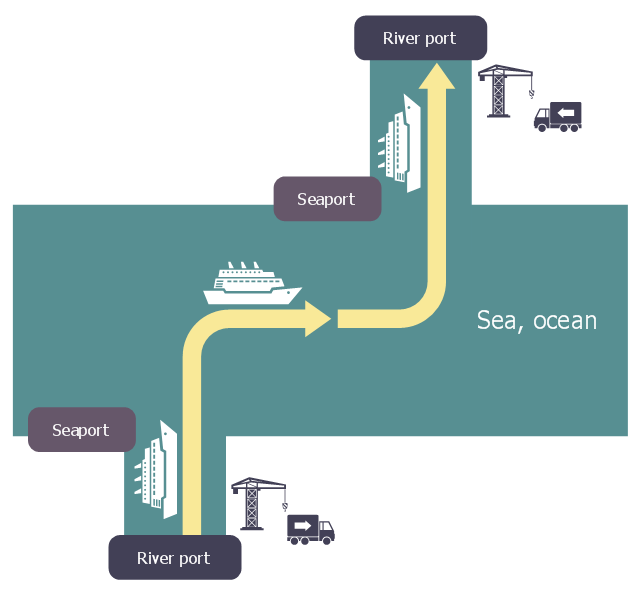
This logistic flow chart sample shows a chain of intermodal transport to link fluvio-maritime.
It was designed on the base of the Wikimedia Commons file: Logistique fluvio-maritime.jpg.
[commons.wikimedia.org/ wiki/ File:Logistique_ fluvio-maritime.jpg]
This file is licensed under the Creative Commons Attribution-Share Alike 3.0 Unported license. [creativecommons.org/ licenses/ by-sa/ 3.0/ deed.en]
"Intermodal freight transport involves the transportation of freight in an intermodal container or vehicle, using multiple modes of transportation (rail, ship, and truck), without any handling of the freight itself when changing modes. The method reduces cargo handling, and so improves security, reduces damage and loss, and allows freight to be transported faster. Reduced costs over road trucking is the key benefit for inter-continental use. This may be offset by reduced timings for road transport over shorter distances." [Intermodal freight transport. Wikipedia]
The logistic flowchart example "Intermodal transport chain" was created using ConceptDraw PRO diagramming and vector drawing software extended with the Logistics Flow Charts solution from the Business Processes area of ConceptDraw Solution Park.
Logistic flowchart
- Logistic Management Flow Chart
- Process Flowchart | Logistics Flow Charts | How to Make a Logistics ...
- Process Flowchart | Logistics Flow Charts | Flow chart Example ...
- CS Odessa Announces Logistics Flow Charts Addition to ...
- How to Make a Logistics Flow Chart
- Flow Chart Logistic
- How to Make a Logistics Flow Chart | Logistics Flow Charts ...
- Logistics Flow Charts | Process Flowchart | Bar Diagrams for ...
- Shipping And Logistics Flow Chart Process
- Flow Chart Of Logistic Company