This site uses cookies. By continuing to browse the ConceptDraw site you are agreeing to our Use of Site Cookies.

ERD Symbols and Meanings

Entity Relationship Diagram (ERD) is a popular software engineering tool for database modeling and illustration the logical structure of databases, which uses one of two notations - Chen's or Crow’s Foot. Crow's foot notation is effective when used in software engineering, information engineering, structured systems analysis and design. Each of these notations applies its own set of ERD symbols. Crow's foot diagrams use boxes to represent entities and lines between these boxes to show relationships. Varied shapes at the ends of lines depict the cardinality of a given relationship. Chen's ERD notation is more detailed way to represent entities and relationships. ConceptDraw DIAGRAM application enhanced with all-inclusive Entity-Relationship Diagram (ERD) solution allows design professional ER diagrams with Chen's or Crow’s Foot notation on your choice. It contains the full set of ready-to-use standardized ERD symbols and meanings helpful for quickly drawing, collection of predesigned ERD samples, examples and templates. ConceptDraw Pro is a great alternative to Visio for Mac users as it offers more features and can easily handle the most demanding professional needs.
How to Build an Entity Relationship Diagram (ERD)
HelpDesk

How to Draw Physics Diagrams

Nothing is more helpful in the study of physics as a visual representation of the physical processes: physics schemes, diagrams, and illustrations. Physics charts can be helpful when you learn Physics, perform experiments, or solve any other tasks regarding Physics. ConceptDraw DIAGRAM allows you to draw physical diagrams of mechanical, nuclear, optical and electrical processes using the set of vector physics symbols and physics diagram templates.
HelpDesk

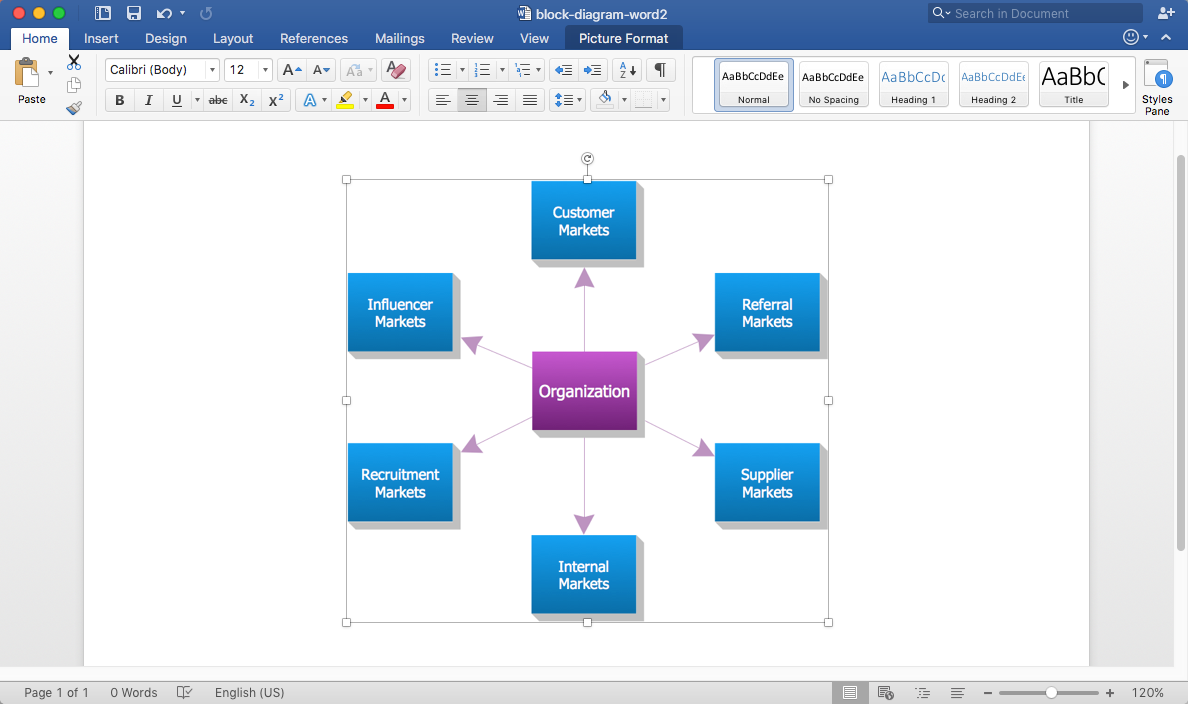
How to Add a Block Diagram to an MS Word ™ Document

Block diagram consists of graphic blocks. Blocks are connected by lines or arrows. Block diagrams are used to show the relationship between parts of some systems. It can be used for the development of new systems or to improve existing ones. The structure of the block diagram gives a high-level overview of the major components of the system, as well as the important relationships. Using the block diagrams, you can more effectively present the business data contained in your MS Word documents. ConceptDraw DIAGRAM allows you to easily create block diagrams and then insert them into an MS Word document.