Swot Analysis Examples for Mac OSX

Cause and Effect Analysis


 Android User Interface
The Android User Interface solution allows ConceptDraw DIAGRAM act as an Android UI design tool. Libraries and templates contain a variety of Android GUI elements to help users create images based on Android UI design.
 iPhone User Interface
iPhone User Interface solution extends ConceptDraw DIAGRAM software with templates, samples and libraries with large quantity of vector stencils of graphical user interface elements, Apps icons, UI patterns for designing and prototyping of the iOS applic
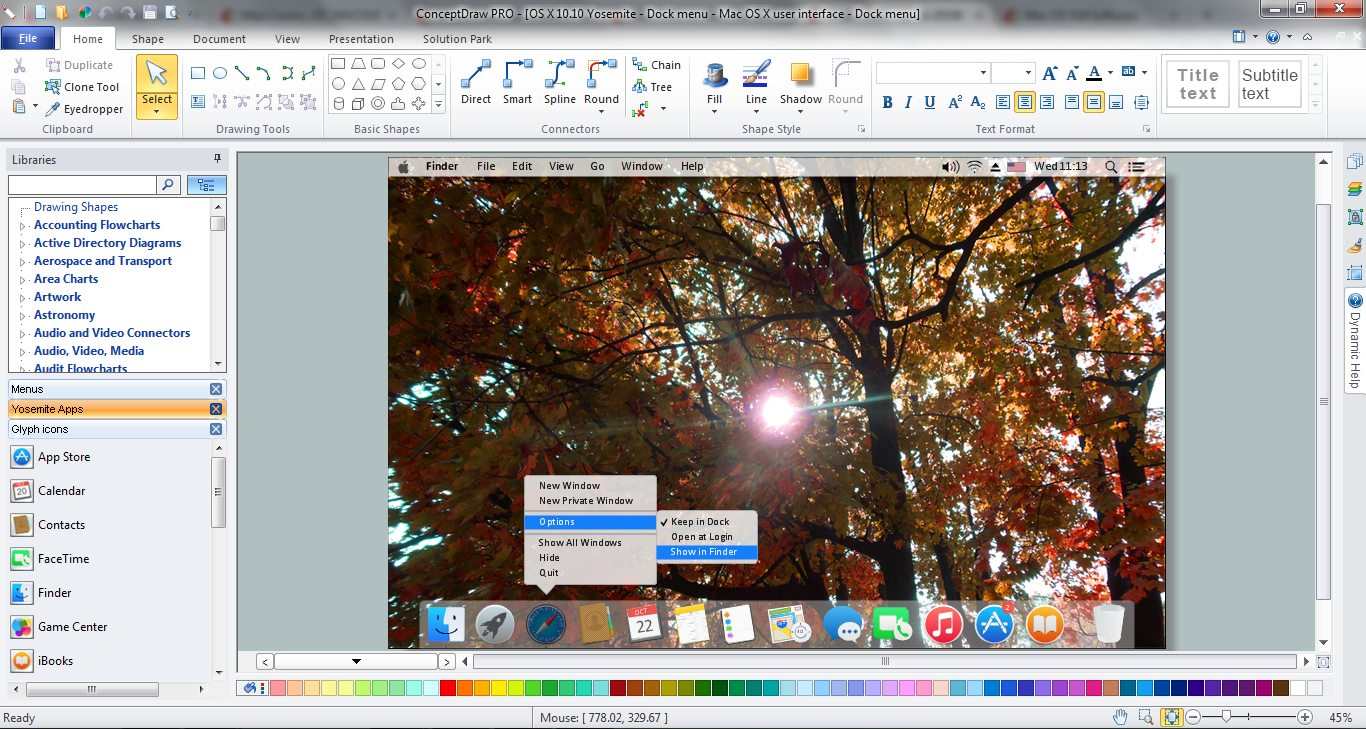
 macOS User Interface
macOS User Interface solution extends the ConceptDraw DIAGRAM functionality with powerful GUI software graphic design features and tools. It provides an extensive range of multifarious macOS Sierra user interface design examples, samples and templates, and wide variety of libraries, containing a lot of pre-designed vector objects of Mac Apps icons, buttons, dialogs, menu bars, indicators, pointers, controls, toolbars, menus, and other elements for fast and simple designing high standard user interfaces of any complexity for new macOS Sierra.
 Windows 10 User Interface
Windows 10 User Interface solution extends significantly ConceptDraw DIAGRAM functionality with look-and-feel functions of GUI software and makes it a great assistant for Win10 designers, developers, and software engineers. This solution provides a wide s
 SWOT and TOWS Matrix Diagrams
SWOT and TOWS Matrix Diagrams solution extends ConceptDraw DIAGRAM and ConceptDraw MINDMAP software with features, templates, samples and libraries of vector stencils for drawing SWOT and TOWS analysis matrices and mind maps.
Mac OS GUI Software
 25 Typical Orgcharts
The 25 Typical Orgcharts solution contains powerful organizational structure and organizational management drawing tools, a variety of professionally designed organization chart and matrix organization structure samples, 25 templates based on various orga
HelpDesk
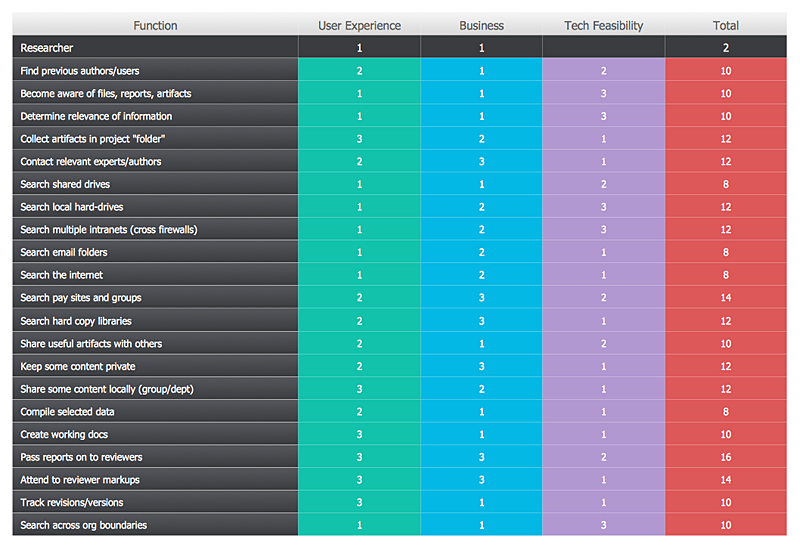
How To Create a Prioritization Matrix
- Seven Basic Tools of Quality | Android User Interface | Seating ...
- Plant Layout Plans | iPhone User Interface | Swot Analysis Template ...
- Mac OS User Interface Design Examples | How to Design a Mockup ...
- How to Draw Business Process Diagrams with RapidDraw Interface ...
- Mac OS User Interface Design Examples | macOS User Interface ...
- Graphical User Interface Examples | Mac OS User Interface Design ...
- Android UI Design | iPhone User Interface | Android GUI | Lock ...
- SWOT and TOWS Matrix Diagrams | Business Process Workflow ...
- macOS User Interface | How to Design a Mockup of Apple macOS ...