HelpDesk
How to Create a SIPOC Diagram Using ConceptDraw PRO

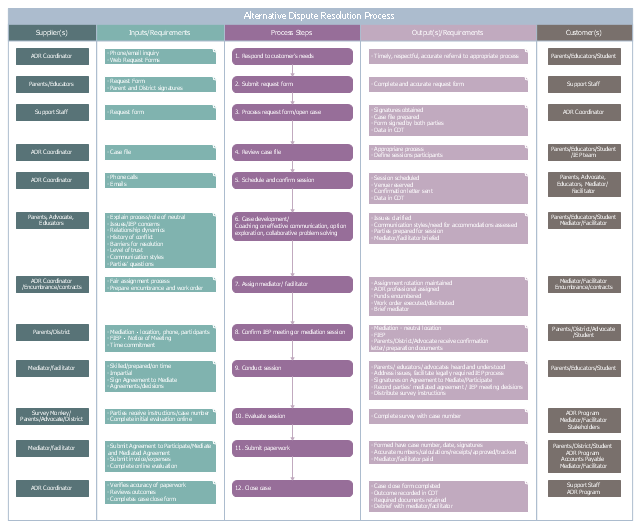
This SIPOC diagram example was designed on the base of the Alternative Dispute Resolution Process SIPOC Diagram on the Minnesota.gov portal.
"Instructions:
1) Identify beginning and ending process steps (boundaries);
2) Identify 4‐6 high‐level steps between process boundaries;
3) Identify key outputs and the customers of those outputs;
4) Identify inputs and suppliers;
5) Identify critical to quality requirements for the inputs, process steps, and outputs (you will have to verify this information later with data collection)."
[mn.gov/ admin/ images/ sipoc_ diagram_ example.pdf]
The example "Alternative Dispute Resolution Process SIPOC Diagram" was drawn using the ConceptDraw PRO diagramming and business graphics software extended with the Business Process Mapping solution from the Business Processes area of ConceptDraw Solution Park.
SIPOC diagram example
HelpDesk
Event-driven Process Chain (EPC) Diagram Software

 Business Process Mapping
The Business Process Mapping solution for ConceptDraw PRO is for users involved in process mapping and creating SIPOC diagrams.
HelpDesk
How to Create a Fault Tree Analysis Diagram (FTD) in ConceptDraw PRO

- Input Process Output Diagram Example
- Input Output Diagram Creator
- Input Output Process Diagram
- Draw Input Output Process Diagram
- Example Of Flowchart That Has Input Process Output And Discussion
- Input Process Output Design Flow
- How To Draw Input Output Diagram
- Input Output Diagram
- System Diagram Examples Input Output
- Block Diagram Of Input Output Analysis Related To Productivity
- Input Output Symbol
- Draw The Input Output Process Diagram
- Example Input And Output Flowchart
- Input Output Diagram Tool
- Draw The Input Output Process Diagram In Management
- Input Process Output Chart
- Symbol Input Output
- Supplier Input Process Output Customer
- Drwa Input Output Process Diagram Mgt
- The Input Output Process Diagram