Diffusion of innovations (DOI) diagram illustrate the diffusion of innovations theory.
"Diffusion of innovations is a theory that seeks to explain how, why, and at what rate new ideas and technology spread through cultures. Everett Rogers, a professor of communication studies, popularized the theory in his book Diffusion of Innovations... The book says that diffusion is the process by which an innovation is communicated through certain channels over time among the members of a social system. ... The book espouses the theory that there are four main elements that influence the spread of a new idea: the innovation, communication channels, time, and a social system. This process relies heavily on human capital. The innovation must be widely adopted in order to self-sustain. Within the rate of adoption, there is a point at which an innovation reaches critical mass. The categories of adopters are: innovators, early adopters, early majority, late majority, and laggards ... Diffusion of Innovations manifests itself in different ways in various cultures and fields and is highly subject to the type of adopters and innovation-decision process." [Diffusion of innovations. Wikipedia]
This DOI chart example was created using the ConceptDraw PRO diagramming and vector drawing software extended with the Marketing Diagrams solution from the Marketing area of ConceptDraw Solution Park.
Diffusion of innovations (DOI)
-diffusion-of-innovations-graph.png--diagram-flowchart-example.png)
How to Create a Cross Functional Flow Chart

This arrow loop cycle diagram sample was created on the base of the figure illustrating the webpage "Exploratory Advanced Research Program Hand-Off Workshops" from the US Department of Transportation - Federal Highway Administration (FHWA) website. "The FHWA’s research and technology innovation life cycle illustrates that research and technology development are not insular activities, but integrated processes that together constitute a system.
Following general workshop discussion, a number of common issues emerged among the groups. These centered around the research life cycle, communicating the value of exploratory advanced research, and continued project funding. It was felt that there is a general need to better describe the research and deployment cycle specific to highway transportation and possibly to highway research fields, such as materials or system planning. Research life cycle diagrams show a very linear, chronological process but it is not necessarily that way in reality." [fhwa.dot.gov/ advancedresearch/ pubs/ 11034/ ]
The arrow loop diagram example "Innovation life cycle" was created using the ConceptDraw PRO diagramming and vector drawing software extended with the Target and Circular Diagrams solution from the Marketing area of ConceptDraw Solution Park.
www.conceptdraw.com/ solution-park/ marketing-target-and-circular-diagrams
Arrow loop cycle diagram
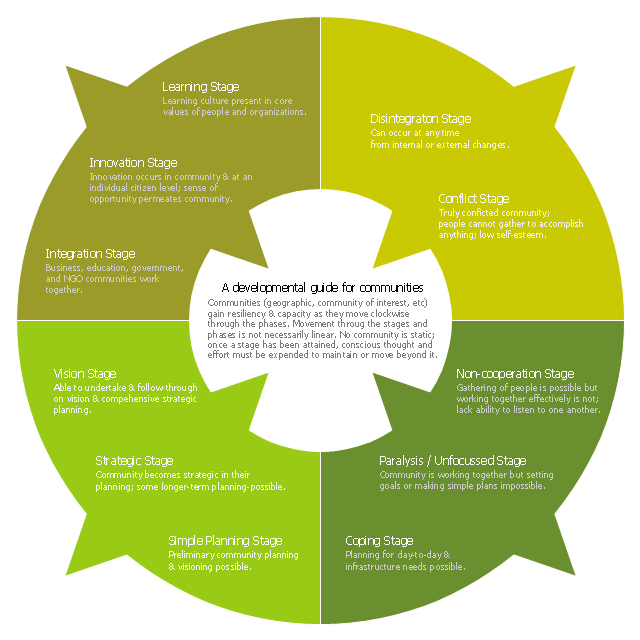
This ring chart sample was created on the base of the figure illustrating the "CCP Handbook - Comprehensive Community Planning for First Nations in British Columbia" from the Government of Canada website. "Tool 1: Centre for Innovative & Entrepreneurial Leadership (CIEL) Community Life Cycle Matrix.
Actualization Phase.
Community is highly developed and encourages learning & innovation while respecting history and culture. Community shares resources with others and regularly monitors itself, continuing to enhance capacity.
Action: Community undertakes regular reviews and reflection activities to maintain or enhance stage / phase.
Pre-Community or Chaos Phase.
Community is undeveloped. Limited sharing of resources or recognition of value of a community.
Action: Community can (re)form through the identification of and action of influential and respected leaders (elected or unelected).
Vision Phase.
Community recognizes the importance of vision and long-term planning; is able to move in this direction.
Action: Community can engage in planning, meaningful consultation of its members, & working towards the development of strategic thinking & planning, and, ultimately, identifying community-wide values, distinct community characteristics and a vision.
Emergence Phase.
Community exists but has significant problems, making anything but survival & fulfilling short-term needs impossible.
Action: Community can advance through focus on small, non-political, trustbuilding projects to build success, respect, confidence, relationships & skills.
Why the Matrix.
The challenge of developing innovative and entrepreneurial communities is in ensuring that the communities have a clear picture of where they are at and where they want to go. This enables a better match of the tools available with both the capacity of the community and the hoped for goal. For example, while strategic planning may work for some communities, the planning process may also lead to frustration and failure in other communities that do not have the necessary trust, social capital or capacity." [aadnc-aandc.gc.ca/ eng/ 1100100021972/ 1100100022090]
The ring chart example "Community life cycle matrix" was created using the ConceptDraw PRO diagramming and vector drawing software extended with the Target and Circular Diagrams solution from the Marketing area of ConceptDraw Solution Park.
www.conceptdraw.com/ solution-park/ marketing-target-and-circular-diagrams
Ring chart
Cubetto Flowchart

 Project Management Area
Project Management area provides Toolbox solutions to support solving issues related to planning, tracking, milestones, events, resource usage, and other typical project management functions.
- Diffusion of innovations graph | Marketing Diagrams | Marketing ...
- Diffusion of innovations graph | Doi Chart
- Program to Make Flow Chart | Innovation life cycle - Arrow loop ...
- Diffusion of innovations graph | How to Create a Cross Functional ...
- Innovation life cycle - Arrow loop diagram | National Preparedness ...
- Innovation life cycle - Arrow loop diagram | Community life cycle ...
- Software workflow diagram | Innovation life cycle - Arrow loop ...
- Innovation life cycle - Arrow loop diagram
- Innovation life cycle - Arrow loop diagram | BPM life cycle | Life cycle ...
- Innovation life cycle - Arrow loop diagram
- Basic Flowchart Symbols and Meaning | Innovation life cycle - Arrow ...
- Diffusion of innovations graph | Marketing Diagrams | Roger S ...
- Use the Best FlowChart Tool for the Job | Innovation life cycle ...
- Strategic planning cycle - Arrow loop diagram | Basic Flowchart ...
- Process Flowchart | Innovation life cycle - Arrow loop diagram | BPR ...
- Innovation life cycle - Arrow loop diagram
- Draw Flowcharts with ConceptDraw | Process Flowchart | Innovation ...
- Innovation life cycle - Arrow loop diagram | Basic Flowchart Symbols ...
- Innovation life cycle - Arrow loop diagram | BPM life cycle | Draw ...
- Innovation life cycle - Arrow loop diagram | Circular Arrows ...