HelpDesk
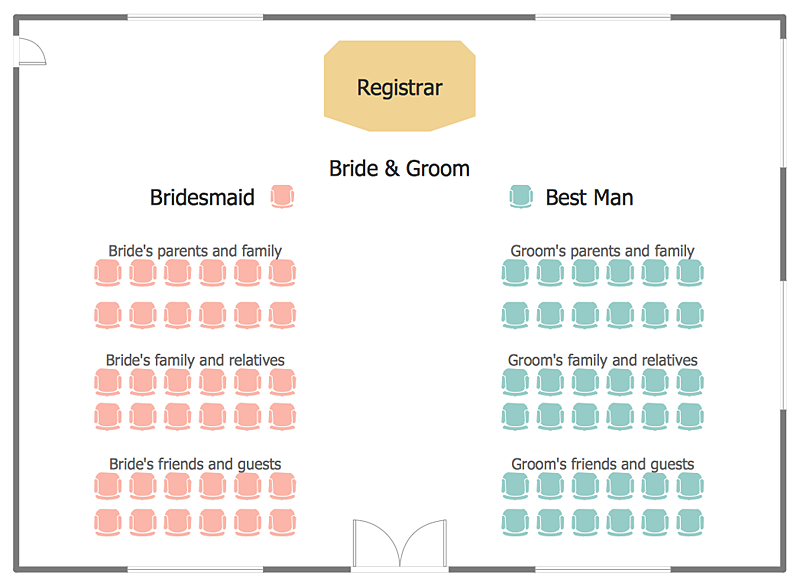
How to Create a Seating Chart for Wedding or Event
Making the guests invited to a wedding or any other special event feel as comfortable as possible, you necessary to take care of the preparation of the seating arrangements plan. That is why it is important to make a detailed table seating chart that will carefully positioning any invitee. Making a Seating Chart template with a help of seating chart software is the best way to represent and prepare a seating plan, for event participants and guests. The ability to design different seating plans is delivered by the ConceptDraw Seating Plans solution. Using ConceptDraw PRO simplifies the complex and cumbersome process of public events organization.HelpDesk
How to Create a Release Burn-Down Chart Using ConceptDraw PRO
The Agile methodology provides project teams the ability to quickly adapt the project to the current situation and thus achieve maximum productivity. According the Scrum method the steps needed to fulfill the project goal breaks down by using short sprints or iterations. The iterations together with an extensive collaboration can increase productivity by better understanding the entire flow of a project. A release burn-down chart is used to track a progress on a Scrum project. The ConceptDraw Scrum Workflow Solution makes it easy for Agile project team to build any professional Scrum diagram such as a Release velocity chart, Release burn-down chart, Sprint burn-down chart, or a Team velocity chart.HelpDesk
How to Create SWOT Analysis Template Using ConceptDraw PRO
SWOT-analysis is used to develop a marketing strategy. SWOT-analysis includes determining the strengths and weaknesses in the company's activity, potential external threats and opportunities and assesses their relative strategic competitors. ConceptDraw SWOT and TOWS Matrix Diagrams solution provide a set of SWOT matrix in which should be recorded and then compared the strengths and weaknesses of the enterprise and the market opportunities and threats. This comparison allows you to determine what steps can be taken for the development of your company and what problems need to be addressed urgently.HelpDesk
How to Use ConceptDraw Sales Dashboard Solution
The interactive visual dashboard is a valuable tool for any sales team. Sales dashboard allows you to view and monitor sales indicators that are important for manager and sales staff . It helps to use the timely and reliable information to improve the quality of sales performance and increase sales revenues. ConceptDraw Sales Dashboard solution is a tool for both: sales manager and sales team. It provides the visualization of key performance indicators that are critical to the entire sales organization. The custom sales dashboard displays the real-time information on sales performance KPIs with the help of intuitive and easy-to-understand diagrams and charts. Sales Dashboard helps the entire team see where they are, and what needs to be done. With ConceptDraw PRO you can easily create a visual Sales Dashboard using Live Objects Technology.
- Furniture Design For Round Shape Get In Home
- Round Table Clipart Plan
- Design elements - Tables | Tables - Vector stencils library | Tables ...
- How To Create Restaurant Floor Plan in Minutes | How To Make a ...
- Design elements - Tables | CAD Drawing Software for Making ...
- Cafe Floor Plan Design Software | Tables - Vector stencils library ...
- Round Table And Chair Clipart
- How To Create Restaurant Floor Plan in Minutes | How to Draw a ...
- Design elements - Tables | Interior Design Office Layout Plan ...
- Design elements - Tables | ERD Symbols and Meanings | Dance ...
- Design elements - Cafe and restaurant | How To Create Restaurant ...
- Symbol for Pool Table for Floor Plans | How To Create Restaurant ...
- Interior Design Office Layout Plan Design Element | Table Seating ...
- How To Create Restaurant Floor Plan in Minutes | Kitchen and ...
- A Students Time Table By Pie Chirt
- Tools To Make A Time Table Graph
- 3 Circle Venn Diagram. Venn Diagram Example | Table Seating ...
- How To Create Restaurant Floor Plan in Minutes | Table Seating ...
- How To Create Restaurant Floor Plan in Minutes | Restaurant Floor ...
- Time Management Tables And Pie Charts


