HelpDesk
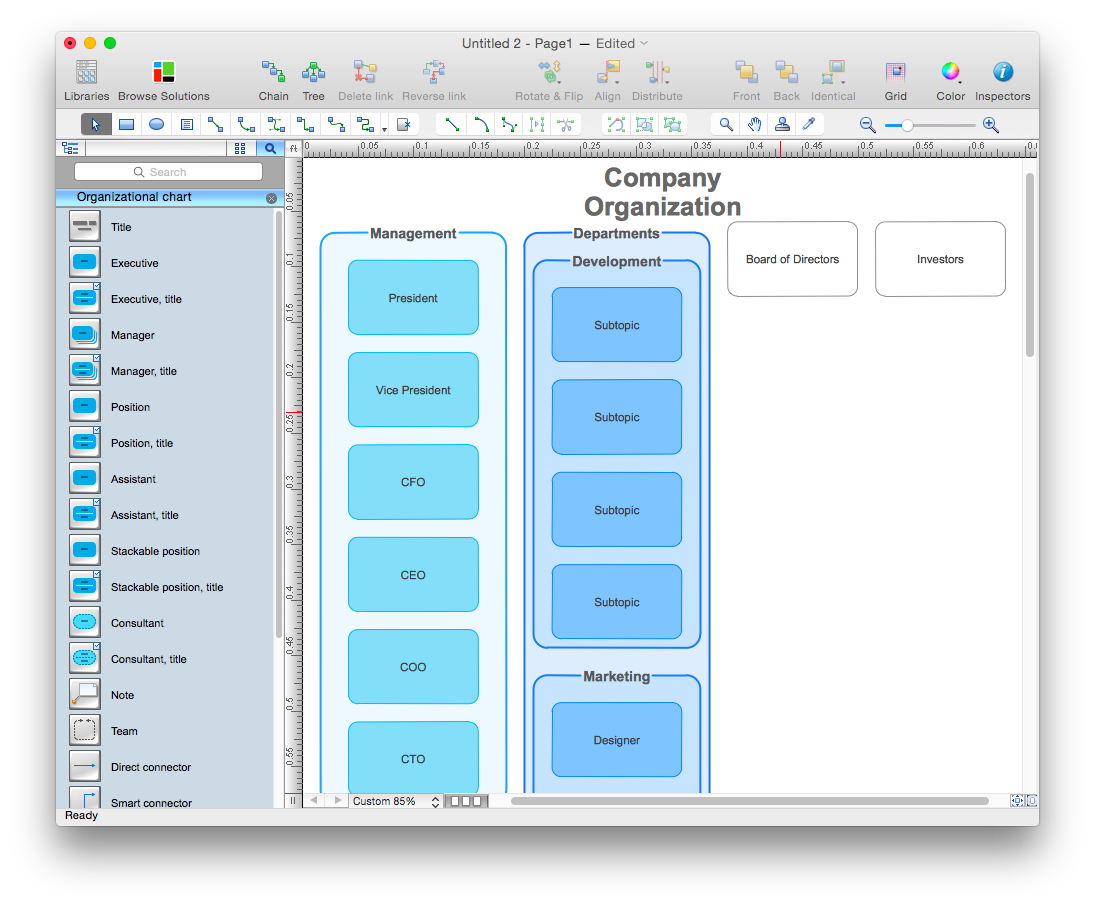
How to Draw an Organizational Chart Using ConceptDraw PRO
The organizational chart software is a valuable tool for modern business. It is important for any business to build a clear organizational structure that determines the responsibilities and relationships between different positions in the organization. The clear structured organization - means the clear structured business workflow, which is the core of success in the business. ConceptDraw PRO is an org chart software that allows you to draw an organizational structure of your company quickly and easily.HelpDesk
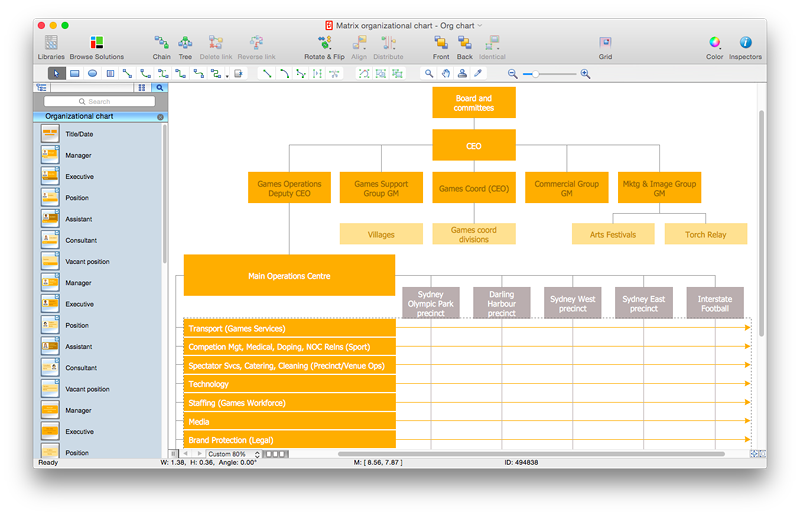
How to Draw a Matrix Organizational Chart with ConceptDraw PRO
There are a number of moments which are influenced on how the organizational structure of a certain business needs to be, how complex, and which type it should keep. The matrix organizational structure is atypical because it brings together employees and managers from different departments to work toward accomplishing a goal. This structure is commonly found in businesses that have more than one line of reportage. For instance, a company might contain an engineering department with engineering managers who workers report to. However, these workers might also have to liaise with different product or project managers depending on current tasks. Some form of matrix organization is found in most large-scale modern businesses. It is one of the most complicated reporting structures. You can easily build a clear matrix organizational chart in ConceptDraw PRO using templates from ConceptDraw Solution Park.HelpDesk
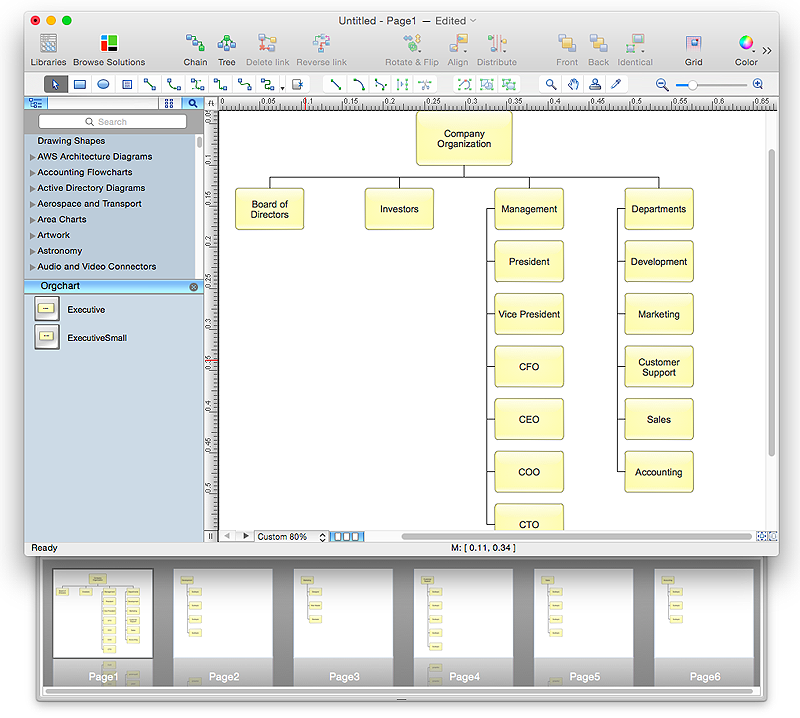
How to Create Organizational Chart Quickly
Use ConceptDraw MINDMAP for generating structured data on organization structure and then ConceptDraw PRO for presenting the results as chart.HelpDesk
How to Create a Bar Chart in ConceptDraw PRO
Bar charts (bar graphs) are diagrams displaying data as horizontal or vertical bars of certain heights. Bar charts are widely used to show and compare the values of the same parameters for different data groups. The bar graph can be vertical or horizontal. This depends on the amount of categories. There are many methods in which bar graph can be built and this makes it a very often used chart type. Usually, a bar chart is created so that the bars are placed vertically. Such arrangement means that the bar's height value is proportional to the category value. Nevertheless, a bar chart can be also drawn horizontally. This means that the longer the bar, the bigger the category. Thus, a bar chart is a good way to present the relative values of different measured items. The ConceptDraw Bar Graphs solution allows you to draw a bar chart quickly using a vector library, containing the set of various bar charts objects.HelpDesk
How to Create Organizational Chart Using Management Solution
Use ConceptDraw MINDMAP for generating structured data on organization structure and then ConceptDraw PRO for presenting the results as chart.HelpDesk
How to Draw a Line Chart Quickly
A common line chart is a graphical representation of the functional relationship between two series of data. A line chart that is created by connecting a series of data points together with a straight line is the most basic type of a line chart. A line chart can be used for depicting data that changes continuously over time. It is extensively utilized in statistics, marketing and financial business. ConceptDraw Line Graph solution provides the possibility to make 2D line charts quickly and effortlessly.- How to Draw an Organization Chart | Organizational Charts with ...
- How to Draw an Organization Chart | How to Draw an ...
- Organizational Structure | How to Draw an Organizational Chart ...
- How to Draw an Organization Chart | Examples of Flowcharts, Org ...
- How to Create Organizational Chart Quickly | How to Draw an ...
- How to Draw a Gantt Chart Using ConceptDraw PRO | How to Draw ...
- Organizational Structure | How to Draw an Organization Chart ...
- Organizational Structure | Draw Company Structure with ...
- How to Draw an Organization Chart | Horizontal Org Flow Chart ...
- How to Draw an Organization Chart | Draw Company Structure with ...
- How to Draw an Organization Chart | Organizational Charts with ...
- How to Draw an Organization Chart | Organizational Structure ...
- Business Structure | Organizational Chart Template | Matrix ...
- How to Draw an Organization Chart | Matrix Organization Structure ...
- Drawing Of Company Institutions Chart
- How to Draw an Organization Chart | Process Flowchart | Draw ...
- Examples of Flowcharts, Org Charts and More | How to Draw an ...
- Examples of Flowcharts, Org Charts and More | Draw Company ...
- How to Draw an Organization Chart | Create Organizational Chart ...
- How to Draw an Organizational Chart Using ConceptDraw PRO ...


