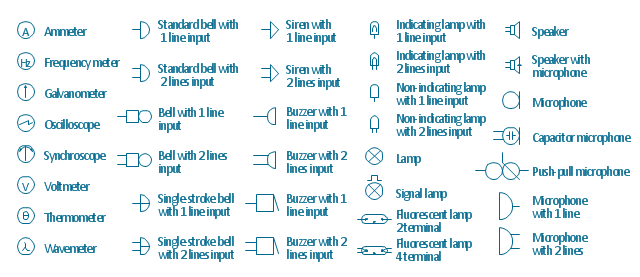
The vector stencils library "Lamps, acoustics, readouts" contains 35 element symbols of lamps, acoustic components, electrical measuring instruments for drawing electrical schematics and electronic circuit diagrams.
"Electrical measurements are the methods, devices and calculations used to measure electrical quantities. Measurement of electrical quantities may be done to measure electrical parameters of a system. Using transducers, physical properties such as temperature, pressure, flow, force, and many others can be converted into electrical signals, which can then be conveniently measured and recorded." [Electrical measurements. Wikipedia]
"A lamp is a replaceable component such as an incandescent light bulb, which is designed to produce light from electricity." [Lamp (electrical component). Wikipedia]
"An electric bell is a mechanical bell that... functions by means of an electromagnet. When an electric current is applied, it produces a repetitive buzzing or clanging sound." [Electric bell. Wikipedia]
"A buzzer or beeper is an audio signalling device, which may be mechanical, electromechanical, or piezoelectric." [Buzzer. Wikipedia]
"Electronic sirens incorporate circuits such as oscillators, modulators, and amplifiers to synthesize a selected siren tone (wail, yelp, pierce/ priority/ phaser, hi-lo, scan, airhorn, manual, and a few more) which is played through external speakers." [Siren (noisemaker). Wikipedia]
"A microphone (colloquially called a mic or mike...) is an acoustic-to-electric transducer or sensor that converts sound in air into an electrical signal. ...
Most microphones today use electromagnetic induction (dynamic microphone), capacitance change (condenser microphone) or piezoelectric generation to produce an electrical signal from air pressure variations." [Microphone. Wikipedia]
The symbols example "Design elements - Lamps, acoustics, readouts" was drawn using the ConceptDraw PRO diagramming and vector drawing software extended with the Electrical Engineering solution from the Engineering area of ConceptDraw Solution Park.
Lamps, acoustics, electrical measuring instruments
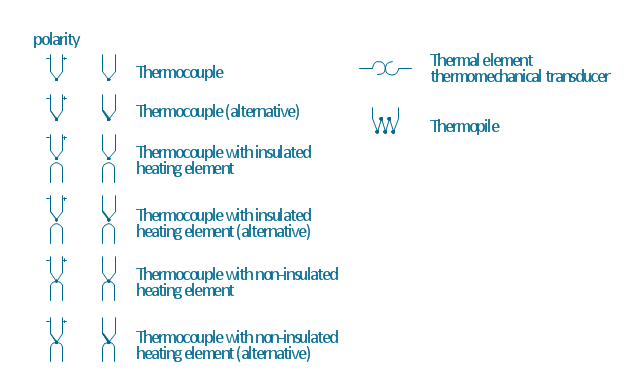
The vector stencils library "Thermo" contains 14 symbols of thermoelectric elements: thermal element, thermocouples with and without heating elements, thermoplile.
Use it for drawing electrical layouts, electronic schematics, and circuit diagrams.
"The thermoelectric effect is the direct conversion of temperature differences to electric voltage and vice versa. A thermoelectric device creates voltage when there is a different temperature on each side. Conversely, when a voltage is applied to it, it creates a temperature difference. At the atomic scale, an applied temperature gradient causes charge carriers in the material to diffuse from the hot side to the cold side.
This effect can be used to generate electricity, measure temperature or change the temperature of objects. Because the direction of heating and cooling is determined by the polarity of the applied voltage, thermoelectric devices can be used as temperature controllers.
The term "thermoelectric effect" encompasses three separately identified effects: the Seebeck effect, Peltier effect, and Thomson effect. Textbooks may refer to it as the Peltier–Seebeck effect. ...
Thermocouples and thermopiles are devices that use the Seebeck effect to measure the temperature difference between two objects, one connected to a voltmeter and the other to the probe. The temperature of the voltmeter, and hence that of the material being measured by the probe, can be measured separately using cold junction compensation techniques." [Thermoelectric effect. Wikipedia]
The shapes example "Design elements - Thermo" was drawn using the ConceptDraw PRO diagramming and vector drawing software extended with the Electrical Engineering solution from the Engineering area of ConceptDraw Solution Park.
Thermoelectric elements
 Floor Plans
Construction, repair and remodeling of the home, flat, office, or any other building or premise begins with the development of detailed building plan and floor plans. Correct and quick visualization of the building ideas is important for further construction of any building.
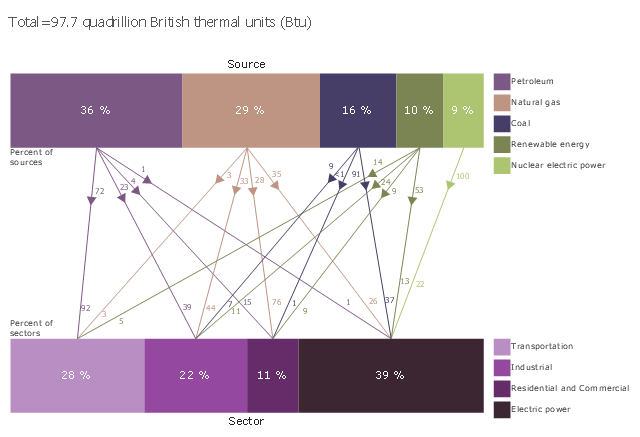
This divided bar diagram sample shows U.S. primary energy consumption by source and sector in 2015. It was designed using data from the chart in the webpage "U.S. Energy Facts Explained, Consumption & Production" on the website of the U.S. Energy Information Administration.
"Americans use many types of energy
Petroleum, natural gas, coal, renewable energy, and nuclear electric power are primary sources of energy. Electricity is a secondary energy source that is generated from primary sources of energy.
Energy sources are measured in different physical units: liquid fuels in barrels or gallons, natural gas in cubic feet, coal in short tons, and electricity in kilowatts and kilowatthours. In the United States, British thermal units (Btu), a measure of heat energy, is commonly used for comparing different types of energy to each other. In 2015, total U.S. primary energy consumption was about 97.7 quadrillion (1015, or one thousand trillion) Btu."
[eia.gov/ energyexplained/ index.cfm?page=us_ energy_ home]
The chart example "U.S. primary energy consumption by source and sector" was created using the ConceptDraw PRO diagramming and vector drawing software extended with the Divided Bar Diagrams solution from the Graphs and Charts area of ConceptDraw Solution Park.
Divided bar chart
Scatter Plot

Network Glossary Definition


- Electrical Symbols, Electrical Diagram Symbols | Electrical Symbols ...
- Symbols Used In Electrical Measuring Instruments
- Design elements - Lamps, acoustics, measuring instruments ...
- Electrical Symbols, Electrical Diagram Symbols | Design elements ...
- Design elements - Video and audio | Design elements - Lamps ...
- Design elements - Lamps, acoustics, measuring instruments | A ...
- Electrical Symbols — Lamps, Acoustics, Readouts | Design ...
- Electrical Symbols, Electrical Diagram Symbols | Lamps, acoustics ...
- Beautiful Nature Scene: Drawing | Design elements - Lamps ...
- Electrical Symbols — Thermo | Electrical Symbols — Resistors ...