 Healthcare Management Workflow Diagrams
Healthcare Management Workflow Diagrams solution contains large set of colorful samples and libraries with predesigned vector pictograms and symbols of health, healthcare equipment, medical instruments, pharmaceutical tools, transport, medication, departments of healthcare organizations, the medical icons of people and human anatomy, as well as the predesigned flowchart objects, connectors and arrows, which make it the best for designing clear and comprehensive Medi?al Workflow Diagrams and Block Diagrams, Healthcare Management Flowcharts and Infographics, Healthcare Workflow Diagram, for depicting the healthcare workflow and clinical workflows in healthcare, for making the workflow analysis healthcare and healthcare workflow management.
HelpDesk
How to Create a Healthcare Management Workflow Diagram

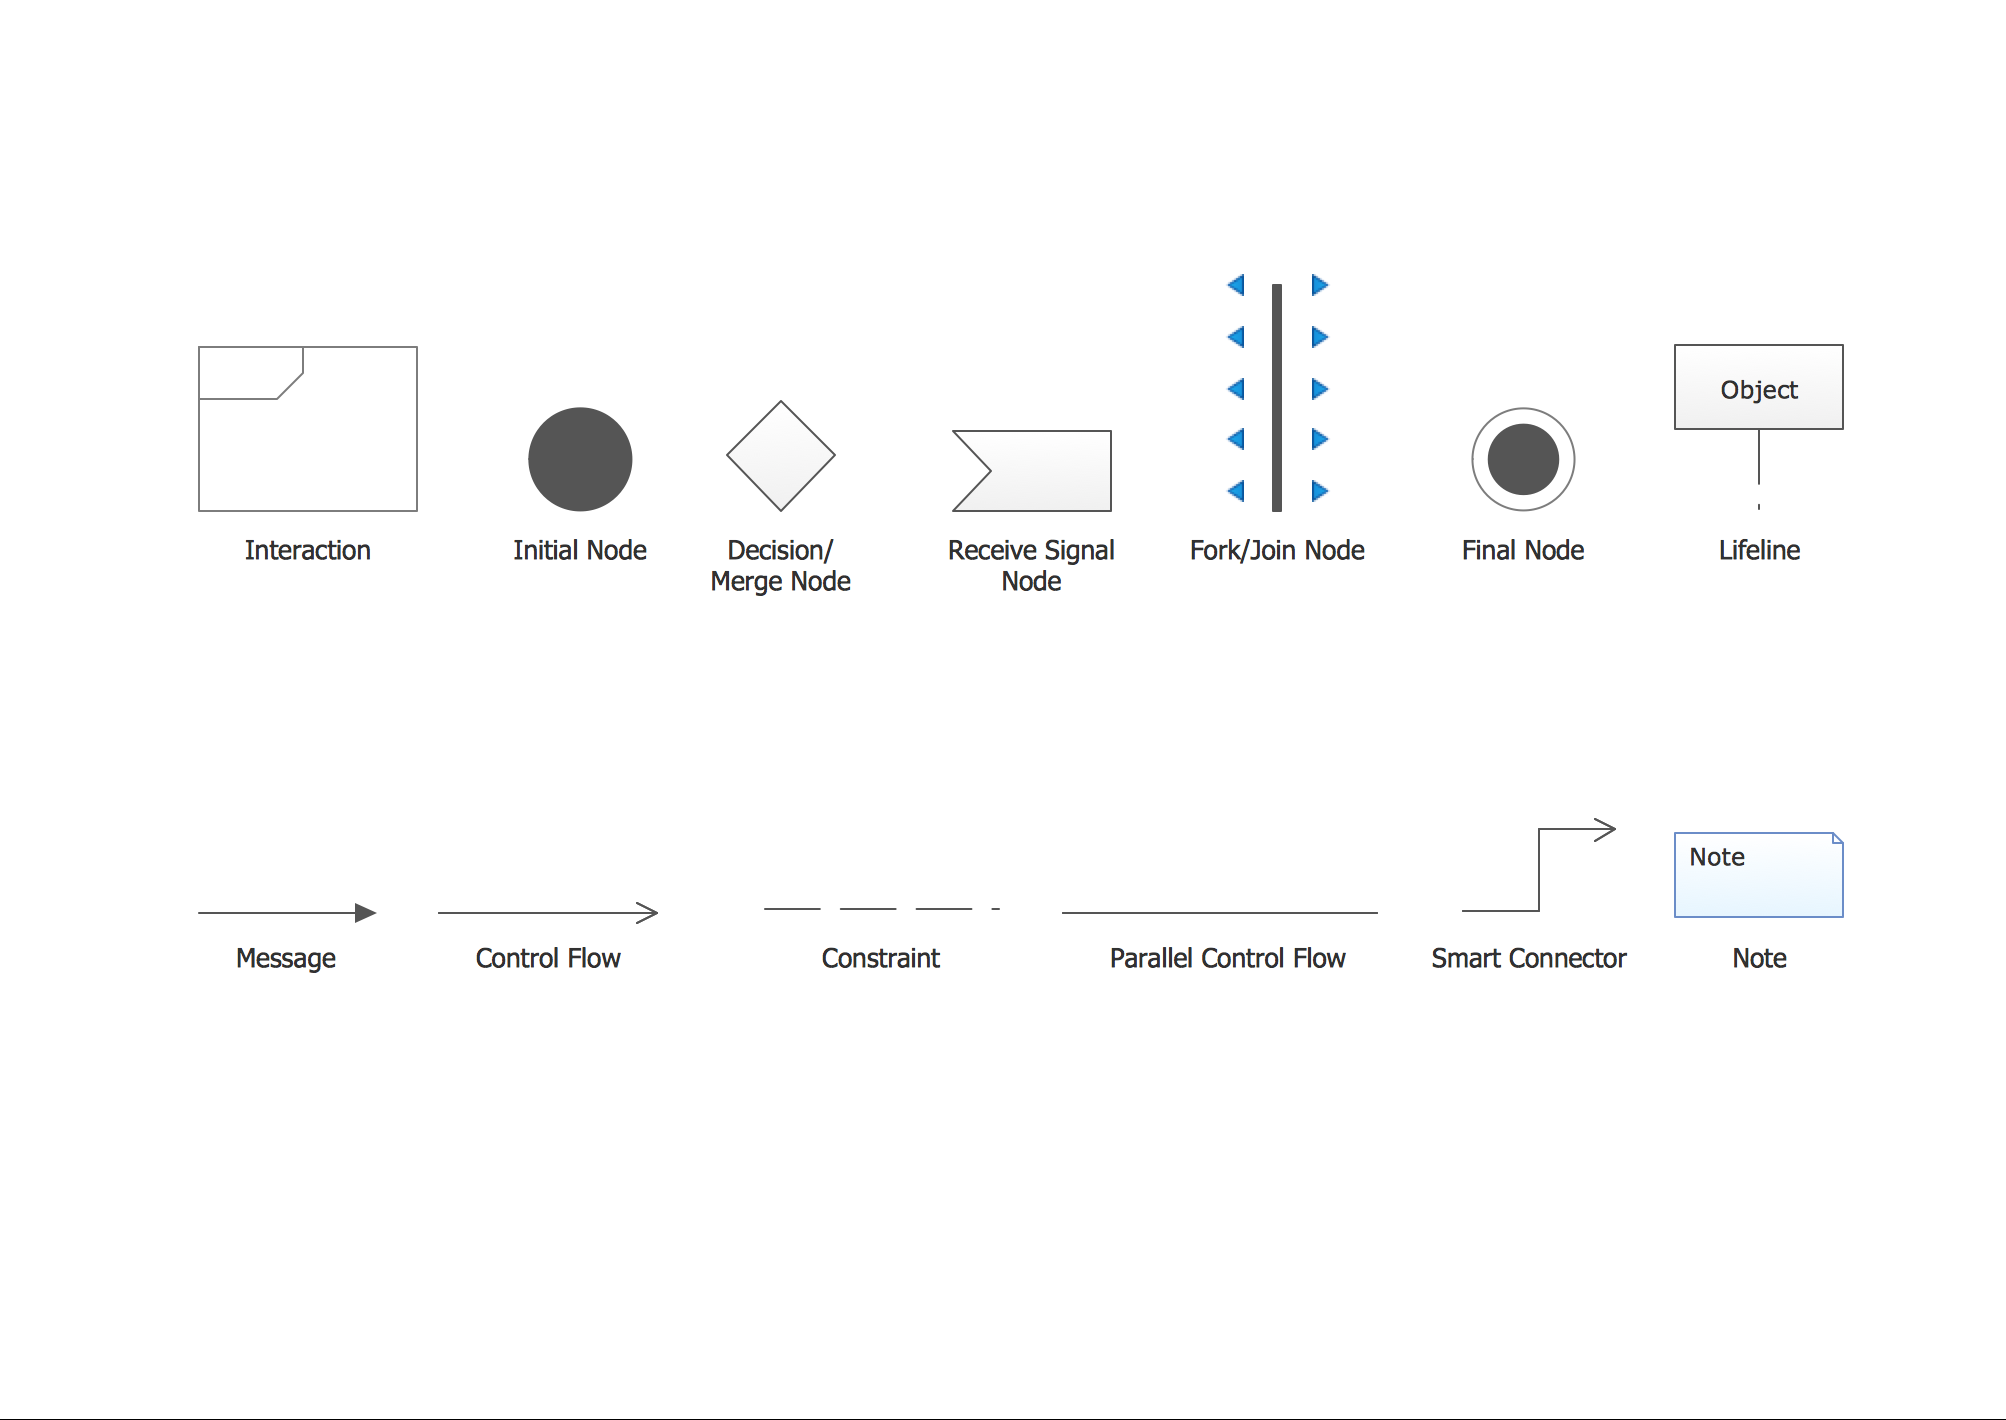
UML Interaction Overview Diagram. Design Elements
Diagramming Software for Design UML Timing Diagrams


Entity Relationship Diagram Software Engineering

Interaction Overview Diagram

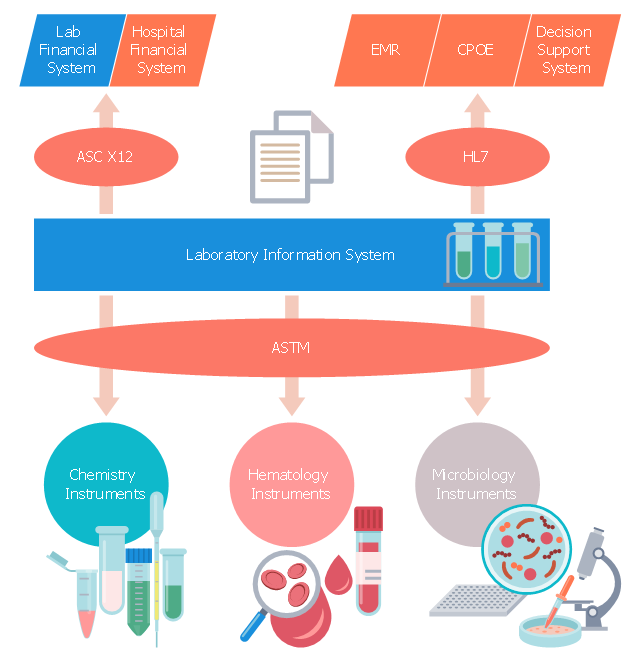
This medical flow chart sample shows logical connections to/ from laboratory information system (LIS) within the hospital.
It was drawn on the base of Wikimedia Commons file: WithinHospital.jpg. [commons.wikimedia.org/ wiki/ File:WithinHospital.jpg]
This file is licensed under the Creative Commons Attribution-Share Alike 3.0 Unported license. [creativecommons.org/ licenses/ by-sa/ 3.0/ deed.en]
"A laboratory information management system (LIMS), sometimes referred to as a laboratory information system (LIS) or laboratory management system (LMS), is a software-based laboratory and information management system with features that support a modern laboratory's operations. Key features include — but are not limited to — workflow and data tracking support, flexible architecture, and data exchange interfaces, which fully "support its use in regulated environments". The features and uses of a LIMS have evolved over the years from simple sample tracking to an enterprise resource planning tool that manages multiple aspects of laboratory informatics." [Laboratory information management system. Wikipedia]
The medical flowchart example "Laboratory Information System within the hospital" was designed using ConceptDraw PRO software extended with Healthcare Workflow Diagrams solution from Business Processes area of ConceptDraw Solution Park.
Medical flowchart
- Activity Diagram For Hospital Management System With Swimlane
- Sequence Diagram Of Hospital Management
- Healthcare Management Workflow Diagrams | Rapid UML ...
- Class Diagram For Hospital Management System
- Healthcare Management Workflow Diagrams | Rapid UML | SYSML ...
- Er Diagram For Hospital Management System With Explanation
- Healthcare Management Workflow Diagrams | Entity-Relationship ...
- Class Diagram For Hospital Management System Pdf
- Dfd 1level Diagram For Hospital Management System
- Data Flow Diagram For Hospital Management System Level 0