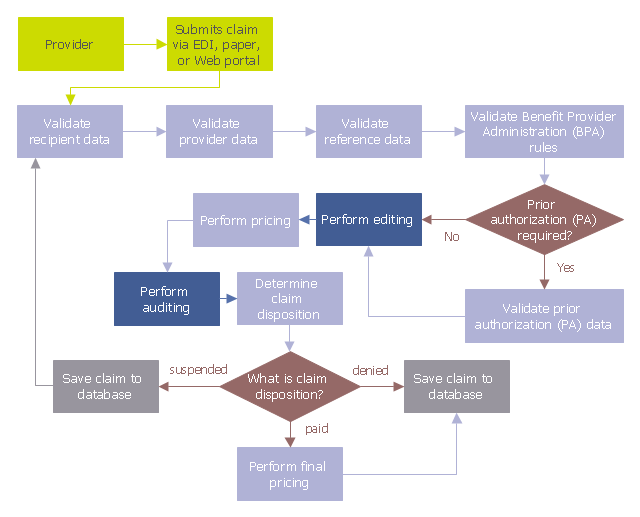
This audit flowchart sample was created on the base of the figure illustrating the webpage "Introduction to Claims Edits, Audits, Error Status Codes, and EOBs" from the website of the Ohio Department of Medicaid.
"Process.
As claims are submitted and processed, the data on the claim is validated against a series of rules, edits, and audits. Review the flowchart below to follow the sequence in which claim data is processed to see where edits and audits impact the claim adjudication process." [medicaid.ohio.gov/ PROVIDERS/ MITS/ MITSNonProviderCommunications/ MITSOnlineTutorials/ IntroductiontoClaimsEdits,Audits.aspx]
The audit flowchart example "Claim data processing" was created using the ConceptDraw PRO diagramming and vector drawing software extended with the Audit Flowcharts solution from the Finance and Accounting area of ConceptDraw Solution Park.
www.conceptdraw.com/ solution-park/ finance-audit-flowcharts
Audit flowchart
"Project planning is part of project management, which relates to the use of schedules such as Gantt charts to plan and subsequently report progress within the project environment.
Initially, the project scope is defined and the appropriate methods for completing the project are determined. Following this step, the durations for the various tasks necessary to complete the work are listed and grouped into a work breakdown structure. Project planning is often used to organize different areas of a project, including project plans, work loads and the management of teams and individuals. The logical dependencies between tasks are defined using an activity network diagram that enables identification of the critical path. Float or slack time in the schedule can be calculated using project management software. Then the necessary resources can be estimated and costs for each activity can be allocated to each resource, giving the total project cost. At this stage, the project schedule may be optimized to achieve the appropriate balance between resource usage and project duration to comply with the project objectives. Once established and agreed, the project schedule becomes what is known as the baseline schedule. Progress will be measured against the baseline schedule throughout the life of the project. Analyzing progress compared to the baseline schedule is known as earned value management.
The inputs of the project planning phase include the project charter and the concept proposal. The outputs of the project planning phase include the project requirements, the project schedule, and the project management plan." [Project planning. Wikipedia]
The flow chart example "Project planning process" was created using the ConceptDraw PRO diagramming and vector drawing software extended with the Flowcharts solution from the area "What is a Diagram" of ConceptDraw Solution Park.
Flowchart - Project planning process

- Flowchart Figures
- Process Flowchart | Scientific Symbols Chart | Basic Flowchart ...
- Process Flow Chart Symbols | Business People Figures | Types of ...
- Basic Flowchart Symbols and Meaning | Mathematical Diagrams ...
- Mathematics Symbols | Basic Flowchart Symbols and Meaning ...
- Scientific Symbols Chart | Basic Flowchart Symbols and Meaning ...
- Plane Figures Drawing Examples Solution
- Basic Flowchart Symbols and Meaning | Process Flowchart | Types ...
- Figure Flowchart And Name
- Plane Figures Flowchart
- Basic Flowchart Symbols and Meaning | UML Notation | Draw Any ...
- Basic Flowchart Symbols and Meaning | Water Cycle Diagram ...
- Basic Flowchart Symbols and Meaning | Mathematics Symbols ...
- Mathematics Symbols | Basic Flowchart Symbols and Meaning ...
- Work Flow Chart | Types of Flowcharts | Business People Figures ...
- Basic Flowchart Symbols and Meaning | How to Draw Geometric ...
- Basic Flowchart Symbols and Meaning | Scientific Symbols Chart ...
- Mathematical Diagrams | Basic Flowchart Symbols and Meaning ...
- Process Flow Chart | Schematic Figure Of Various Maths Items