 Entity-Relationship Diagram (ERD)
Entity-Relationship Diagram (ERD) solution extends ConceptDraw PRO software with templates, samples and libraries of vector stencils from drawing the ER-diagrams by Chen's and crow’s foot notations.
 Entity-Relationship Diagram (ERD)
An Entity-Relationship Diagram (ERD) is a visual presentation of entities and relationships. That type of diagrams is often used in the semi-structured or unstructured data in databases and information systems. At first glance ERD is similar to a flowch
 Comparison Dashboard
Comparison dashboard solution extends ConceptDraw PRO software with samples, templates and vector stencils library with charts and indicators for drawing the visual dashboard comparing data.
HelpDesk
How to Create a Bubble Diagram Using ConceptDraw PRO
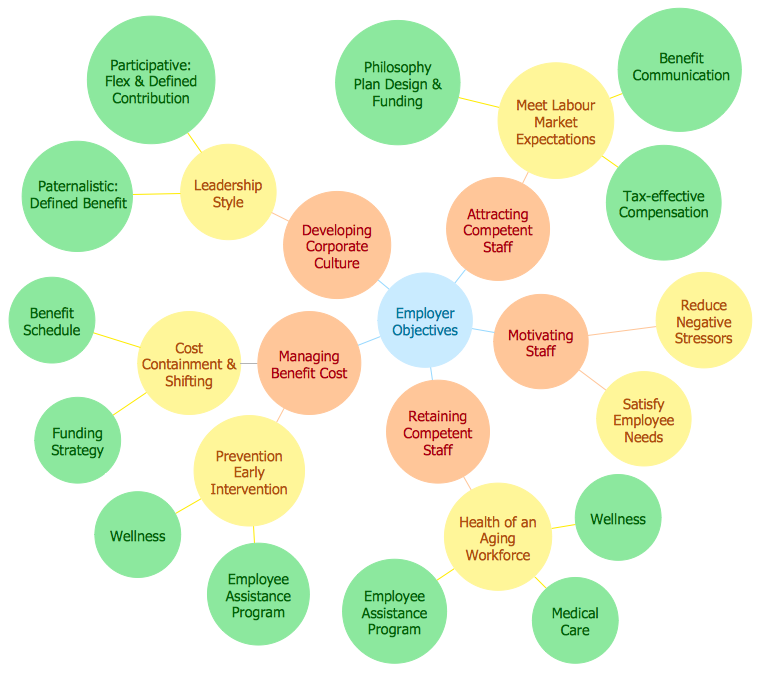
Bubble Diagram is a simple chart that consists of circles (bubbles) repesening certain topics or processes. Bubbles are connected by lines depicting the type of relationships between the bubbles. The size of each bubble is depended on the importance of the entity it represents. Bubble charts are widely used throughout social, economical, medical, and other scientific researches as well as throughout architecture and business management. Bubble charts are often used during the early stages of product development to visualize thoughts and ideas for the purpose of sketching out a development plan. ConceptDraw PRO allows you to draw a bubble diagrams using the Bubble Diagrams solution.
 Basic Divided Bar Diagrams
This solution extends the capabilities of ConceptDraw PRO v10.3.0 (or later) with templates, samples and a library of vector stencils for drawing Divided Bar diagrams.
 Website Wireframe
The innovative Website Wireframe solution enhances the ConceptDraw PRO v10 functionality with newest wireframe tools, libraries with variety of predesigned icons, symbols, buttons, graphics, forms, boxes, and many other vector elements, templates and professionally designed samples, which make it the best wireframing software. Website Wireframe solution gives you significant advantages when designing and maintaining websites, creating skeletal and content-free depictions of website structure, making website prototypes and planning the content arrangement before committing to design, also speeds up the processes of sketching, producing and sharing wireframe examples of website style and interface design.
 Bubble Diagrams
Bubble diagrams have enjoyed great success in software engineering, architecture, economics, medicine, landscape design, scientific and educational process, for ideas organization during brainstorming, for making business illustrations, presentations, planning, design, and strategy development. They are popular because of their simplicity and their powerful visual communication attributes.
 Divided Bar Diagrams
The Divided Bar Diagrams Solution extends the capabilities of ConceptDraw PRO v10 with templates, samples, and a library of vector stencils for drawing high impact and professional Divided Bar Diagrams and Graphs, Bar Diagram Math, and Stacked Graph.
 Composition Dashboard
Composition dashboard solution extends ConceptDraw PRO software with templates, samples and vector stencils library with charts and indicators for drawing visual dashboards showing data composition.
 Venn Diagrams
Venn Diagrams are actively used to illustrate simple set relationships in set theory and probability theory, logic and statistics, mathematics and computer science, linguistics, sociology, and marketing. Venn Diagrams are also often used to visually summarize the status and future viability of a project.
- Compare A Data Flow Model With An Entity Relationship Model With
- Entity Relationship Diagram Symbols | Example of DFD for Online ...
- Compare The Data Flow Model With And Entity Relationship With
- Uml Data Flow Diagram Entity Relationship Comparison Chart
- Example of DFD for Online Store (Data Flow Diagram ) DFD ...
- Example of DFD for Online Store (Data Flow Diagram ) DFD ...
- Entity-Relationship Diagram (ERD) | Computer and Networks Area ...
- Entity Relationship Diagram - ERD - Software for Design Crows Foot ...
- Example of DFD for Online Store (Data Flow Diagram ) DFD ...
- Entity Relationship Diagram - ERD - Software for Design Crows Foot ...
- Example of DFD for Online Store (Data Flow Diagram ) DFD ...
- Data flow Model Diagram
- Example of DFD for Online Store (Data Flow Diagram ) DFD ...
- Basic Flowchart Symbols and Meaning | Database Flowchart ...
- ConceptDraw PRO ER Diagram Tool | Example of DFD for Online ...
- Mind Mapping For Shopping Mall Management
- Example Of Erd Diagram For Fast Food Service
- Business diagrams & Org Charts with ConceptDraw PRO | Example ...
- Data Flow Diagram
- Structured Systems Analysis and Design Method (SSADM) with ...
