 Entity-Relationship Diagram (ERD)
An Entity-Relationship Diagram (ERD) is a visual presentation of entities and relationships. That type of diagrams is often used in the semi-structured or unstructured data in databases and information systems. At first glance ERD is similar to a flowch
Data structure diagram with ConceptDraw PRO

"Chen's notation for entity–relationship modeling uses rectangles to represent entity sets, and diamonds to represent relationships appropriate for first-class objects: they can have attributes and relationships of their own. If an entity set participates in a relationship set, they are connected with a line.
Attributes are drawn as ovals and are connected with a line to exactly one entity or relationship set.
Cardinality constraints are expressed as follows:
- a double line indicates a participation constraint, totality or surjectivity: all entities in the entity set must participate in at least one relationship in the relationship set;
- an arrow from entity set to relationship set indicates a key constraint, i.e. injectivity: each entity of the entity set can participate in at most one relationship in the relationship set;
- a thick line indicates both, i.e. bijectivity: each entity in the entity set is involved in exactly one relationship.
- an underlined name of an attribute indicates that it is a key: two different entities or relationships with this attribute always have different values for this attribute.
Attributes are often omitted as they can clutter up a diagram; other diagram techniques often list entity attributes within the rectangles drawn for entity sets." [Entity–relationship model. Wikipedia]
The vector stencils library ERD, Chen's notation contains 13 symbols for drawing entity-relatinship diagrams using the ConceptDraw PRO diagramming and vector drawing software.
The example "Design elements - ER diagram (Chen notation)" is included in the Entity-Relationship Diagram (ERD) solution from the Software Development area of ConceptDraw Solution Park.
Chen's ERD
.png--diagram-flowchart-example.png)
This ERD sample was redesigned from the Wikimedia Commons file: Entity-Relationship Model (diagram).png. [commons.wikimedia.org/ wiki/ File:Entity-Relationship_ Model_ %28diagram%29.png]
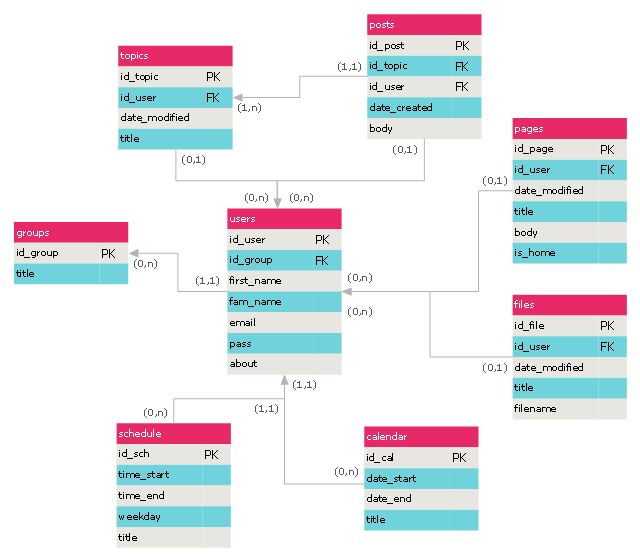
"An entity-relationship model is a systematic way of describing and defining a business process. The process is modeled as components (entities) that are linked with each other by relationships that express the dependencies and requirements between them...
Entities may have various properties (attributes) that characterize them. Diagrams created to represent these entities, attributes, and relationships graphically are called entity–relationship diagrams.
An ER model is typically implemented as a database. In the case of a relational database, which stores data in tables, which represent the entities. Some data fields in these tables point to indexes in other tables; such pointers represent the relationships." [Entity–relationship model. Wikipedia]
The ERD example "Entity-relationship model diagram" was created using the ConceptDraw PRO diagramming and vector drawing software extended with the Entity-Relationship Diagram (ERD) solution from the Software Development area of ConceptDraw Solution Park.
ERD
"In software engineering, an entity–relationship model (ER model) is a data model for describing a database in an abstract way. ...
Crow's Foot notation is used in Barker's Notation, SSADM and Information Engineering. Crow's Foot diagrams represent entities as boxes, and relationships as lines between the boxes. Different shapes at the ends of these lines represent the cardinality of the relationship." [Entity–relationship model. Wikipedia]
This ERD example was redesigned using the ConceptDraw PRO diagramming and vector drawing software from the educational data base model. [www2.cs.uregina.ca/ ~bernatja/ crowsfoot.html]
The example "Entity-relationship diagram (Crow's foot notation)" is included in the Entity-Relationship Diagram (ERD) solution from the Software Development area of ConceptDraw Solution Park.
Crow's foot ERD
.png--diagram-flowchart-example.png)
- Entity Relationship Diagram Symbols and Meaning ERD Symbols ...
- Design elements - ERD (crow's foot notation) | Entity Relationship ...
- Design elements - ER diagram (Chen notation) | Entity -Relationship ...
- Entity Relationship Diagram Symbols and Meaning ERD Symbols ...
- Design elements - ER diagram (Chen notation) | Design elements ...
- Entity -Relationship Diagram (ERD)
- Entity -Relationship Diagram (ERD) | Entity Relationship Diagram ...
- Entity Relationship Diagram Software for Design Crows Foot ER ...
- Entity Relationship Diagram Software Engineering | Entity ...
- Data Flow Diagram Symbols. DFD Library | Entity Relationship ...
- Entity -Relationship Diagram
- Entity -Relationship Diagram (ERD) with ConceptDraw PRO | IDEF0 ...
- Data Flow Diagrams | Entity Relationship Diagram Examples ...
- Entity Relationship Diagram Symbols
- Entity Relationship Diagram Software for Mac | Entity -Relationship ...
- Entity Relationship Diagram Examples | Local area network (LAN ...
- Gane Sarson Diagram | Data Flow Diagram Symbols. DFD Library ...
- Entity -Relationship Diagram (ERD) | ConceptDraw PRO ER ...
- Entity Relationship Diagram Software for Mac | ER Diagram ...
- Detailed Entity Relationship Diagram Example For Management