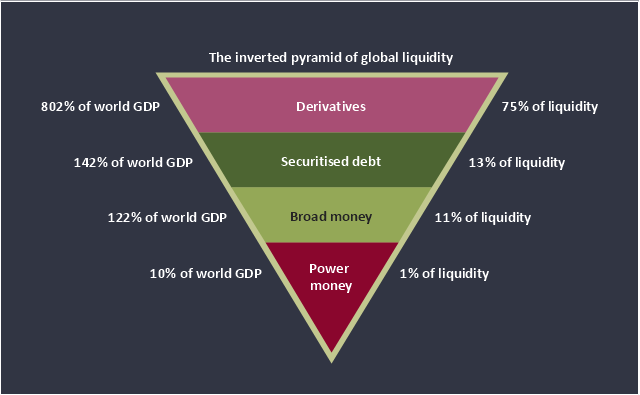
This inverted pyramid diagram of global liquidity shows world GDP and liquidity for 4 levels: derivatives, securitised debt, broad money, and power money.
"In business, economics or investment, market liquidity is a market's ability to facilitate an asset being sold quickly without having to reduce its price very much (or even at all). Equivalently, an asset's market liquidity (or simply "an asset's liquidity") is the asset's ability to sell quickly without having to reduce its price very much. Liquidity is about how big the trade-off is between the speed of the sale and the price it can be sold for. In a liquid market, the trade-off is mild: selling quickly will not reduce the price much. In a relatively illiquid market, selling it quickly will require cutting its price by some amount.
Money, or cash, is the most liquid asset, because it can be "sold" for goods and services instantly with no loss of value. There is no wait for a suitable buyer of the cash. There is no trade-off between speed and value. It can be used immediately to perform economic actions like buying, selling, or paying debt, meeting immediate wants and needs.
If an asset is moderately (or very) liquid, it has moderate (or high) liquidity. In an alternative definition, liquidity can mean the amount of highly liquid assets. If a business has moderate liquidity, it has a moderate amount of very liquid assets. If a business has sufficient liquidity, it has a sufficient amount of very liquid assets and the ability to meet its payment obligations." [Market liquidity. Wikipedia]
This inverted triangle diagram was redesigned using the ConceptDraw PRO diagramming and vector drawing software from Wikimedia Commons file The inverted pyramid of global liquidity.gif. [commons.wikimedia.org/ wiki/ File:The_ inverted_ pyramid_ of_ global_ liquidity.gif]
This triangular chart example is included in the Pyramid Diagrams solution from the Marketing area of ConceptDraw Solution Park.
Inverted pyramid diagram
 Target and Circular Diagrams
This solution extends ConceptDraw PRO software with samples, templates and library of design elements for drawing the Target and Circular Diagrams.
 Cloud Computing Diagrams
The Cloud Computing Diagrams solution extends the functionality of the ConceptDraw PRO software with comprehensive collection of libraries of cloud computing vector stencils to help you get started design of Cloud Computing Diagrams and Architecture D
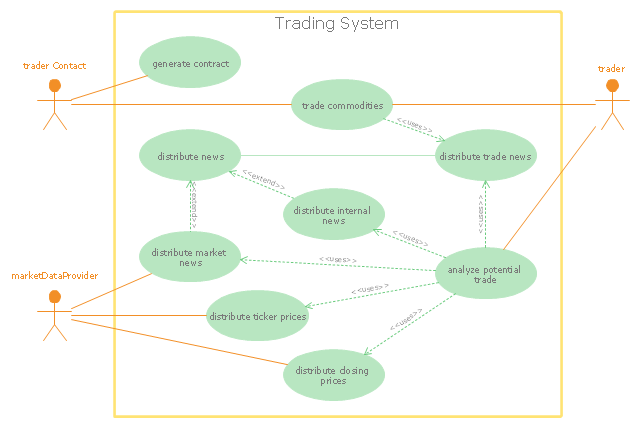
"Algorithmic trading, also called automated trading, black-box trading, or algo trading, is the use of electronic platforms for entering trading orders with an algorithm which executes pre-programmed trading instructions whose variables may include timing, price, or quantity of the order, or in many cases initiating the order by a "robot", without human intervention. Algorithmic trading is widely used by investment banks, pension funds, mutual funds, and other buy-side (investor-driven) institutional traders, to divide large trades into several smaller trades to manage market impact and risk. Sell side traders, such as market makers and some hedge funds, provide liquidity to the market, generating and executing orders automatically.
A special class of algorithmic trading is "high-frequency trading" (HFT), which is often most profitable during periods of high market volatility. During the past years, companies such as Algorates have employed HFT strategies, recording high profits even during periods in which the markets have seen steep declines." [Algorithmic trading. Wikipedia]
The UML use case diagram example "Trading system usage scenarios" was created using the ConceptDraw PRO diagramming and vector drawing software extended with the Rapid UML solution from the Software Development area of ConceptDraw Solution Park.
UML use case diagram
- Diagram Draw Marketing And Selling
- Diagram Of Selling Procedure
- Selling Concept With Diagram
- Diagram Of Marketing And Selling System
- Selling Price Of A Product Block Diagram
- Six Markets Model Chart | Target market - Onion diagram | Marketing ...
- Diagram Of Selling And Marketing Concept
- With The Aid Of Diagram Explain Selling And Sale Management
- Diagram Of Selling Concept
- Draw A Diagram Of Selling And Marketing Concept With Pictures
- Diagram Procedure Of Selling A Car
- Selling Product Diagram Example
- Block Diagram Of Selling Price Of A Product
- Selling Peocess Diagram
- Market Selling Content Of Diagram
- Entity-Relationship Diagram (ERD) | The Sales Process | Example of ...
- Block diagram - Selling technology patent process
- Pyramid Diagram | Pyramid Diagram | Fundraising Pyramid ...
- SSADM Diagram | Target Diagram | Block diagram - Selling ...
- Simple Diagram On System Of Selling Cars In Sytem Analysis And