LLNL Flow Charts
.jpg "LLNL flow charts")
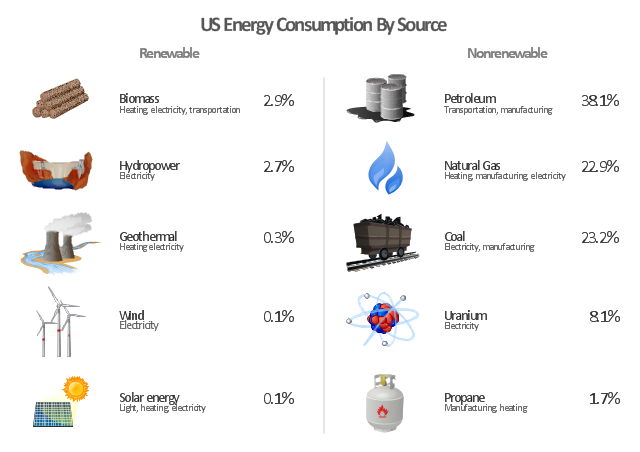
"The United States is the 800th largest energy consumer in terms of total use in 2010. ...
The majority of this energy is derived from fossil fuels: in 2010, data showed 25% of the nation's energy came from petroleum, 22% from coal, and 22% from natural gas. Nuclear power supplied 8.4% and renewable energy supplied 8%, which was mainly from hydroelectric dams although other renewables are included such as wind power, geothermal and solar energy." [Energy in the United States. Wikipedia]
The infographics example "U.S. energy consumption by source" was created in the ConceptDraw PRO diagramming and vector drawing software using the Manufacturing and Maintenance solution from the Illustration area of ConceptDraw Solution Park.
Infographics
Rack Diagrams


"Consumption of energy resources, (e.g. turning on a light) requires resources and has an effect on the environment. Many electric power plants burn coal, oil or natural gas in order to generate electricity for energy needs. While burning these fossil fuels produces a readily available and instantaneous supply of electricity, it also generates air pollutants including carbon dioxide (CO2), sulfur dioxide and trioxide (SOx) and nitrogen oxides (NOx). Carbon dioxide is an important greenhouse gas which is thought to be responsible for some fraction of the rapid increase in global warming seen especially in the temperature records in the 20th century, as compared with tens of thousands of years worth of temperature records which can be read from ice cores taken in Arctic regions. Burning fossil fuels for electricity generation also releases trace metals such as beryllium, cadmium, chromium, copper, manganese, mercury, nickel, and silver into the environment, which also act as pollutants.
The large-scale use of renewable energy technologies would "greatly mitigate or eliminate a wide range of environmental and human health impacts of energy use". Renewable energy technologies include biofuels, solar heating and cooling, hydroelectric power, solar power, and wind power. Energy conservation and the efficient use of energy would also help." [Energy industry. Environmental impact. Wikipedia]
The Energy resources diagram example was created in the ConceptDraw PRO diagramming and vector drawing software using the Manufacturing and Maintenance solution from the Illustration area of ConceptDraw Solution Park.
Infographics

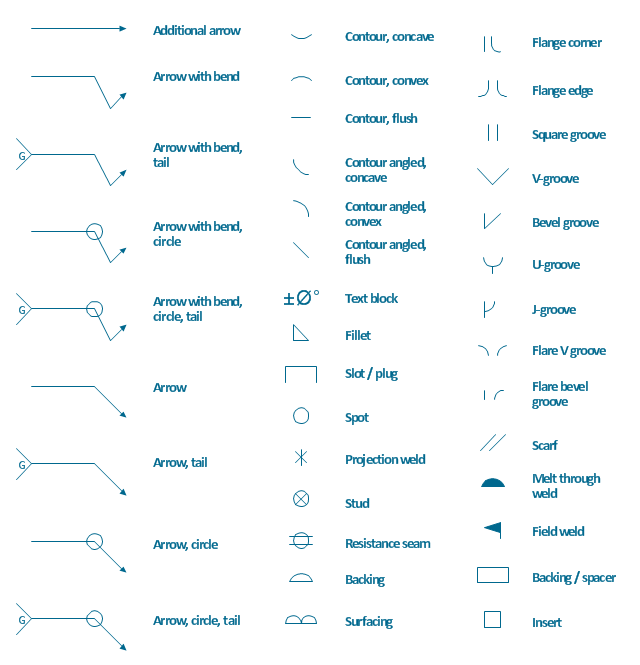
The vector stencils library "Welding" contains 38 welding joint symbols to identify fillets, contours, resistance seams, grooves, surfacing, and backing.
Use it to indicate welding operations on working drawings.
"Welding is a fabrication or sculptural process that joins materials, usually metals or thermoplastics, by causing coalescence. This is often done by melting the workpieces and adding a filler material to form a pool of molten material (the weld pool) that cools to become a strong joint, with pressure sometimes used in conjunction with heat, or by itself, to produce the weld. This is in contrast with soldering and brazing, which involve melting a lower-melting-point material between the workpieces to form a bond between them, without melting the workpieces.
Many different energy sources can be used for welding, including a gas flame, an electric arc, a laser, an electron beam, friction, and ultrasound.
Welds can be geometrically prepared in many different ways. The five basic types of weld joints are the butt joint, lap joint, corner joint, edge joint, and T-joint (a variant of this last is the cruciform joint). Other variations exist as well - for example, double-V preparation joints are characterized by the two pieces of material each tapering to a single center point at one-half their height. Single-U and double-U preparation joints are also fairly common - instead of having straight edges like the single-V and double-V preparation joints, they are curved, forming the shape of a U. Lap joints are also commonly more than two pieces thick - depending on the process used and the thickness of the material, many pieces can be welded together in a lap joint geometry." [Welding. Wikipedia]
The shapes example "Design elements - Welding" was created using the ConceptDraw PRO diagramming and vector drawing software extended with the Mechanical Engineering solution from the Engineering area of ConceptDraw Solution Park.
Welding joint symbols
- Drawings Of Energy Resources
- Resources and energy - Vector stencils library | Energy resources ...
- Drawings And Diagrams For Conventional Sources Of Energy
- Biomass Energy Drawing
- Drawing On Energy Sources
- U.S. energy consumption by source | Target and Circular Diagrams ...
- Energy Pyramid Diagram | How to Create a Scatter Chart | U.S. ...
- Resources and energy - Vector stencils library | Chemistry Drawings ...
- Examples Of Energy Sources
- Electrical Symbols — Power Sources | Electrical Drawing Software ...
- Nice And Easy Drawings Of Sources Of Energy
- Drawing Energy Resoures
- Drawings Of Energy Foods
- Energy resources diagram | Manufacturing and Maintenance ...
- Energy Conversion Drawing
- Process Diagrams | Resources and energy - Vector stencils library ...
- Domestic sector SWOT | Pie chart - Domestic energy consumption ...
- Energy resources diagram | Circular Arrows Diagrams | Rolla USGS ...
- Energy resources diagram | Vector Map of Germany | U.S. energy ...
- Energy Resources Drawing