HelpDesk
How to Create a Timeline Diagram

 Event-driven Process Chain Diagrams
Event-Driven Process Chain Diagrams solution extends ConceptDraw DIAGRAM functionality with event driven process chain templates, samples of EPC engineering and modeling the business processes, and a vector shape library for drawing the EPC diagrams and EPC flowcharts of any complexity. It is one of EPC IT solutions that assist the marketing experts, business specialists, engineers, educators and researchers in resources planning and improving the business processes using the EPC flowchart or EPC diagram. Use the EPC solutions tools to construct the chain of events and functions, to illustrate the structure of a business process control flow, to describe people and tasks for execution the business processes, to identify the inefficient businesses processes and measures required to make them efficient.
HelpDesk
ConceptDraw OFFICE for macOS Installation Definition

Bubble diagrams in Landscape Design with ConceptDraw DIAGRAM

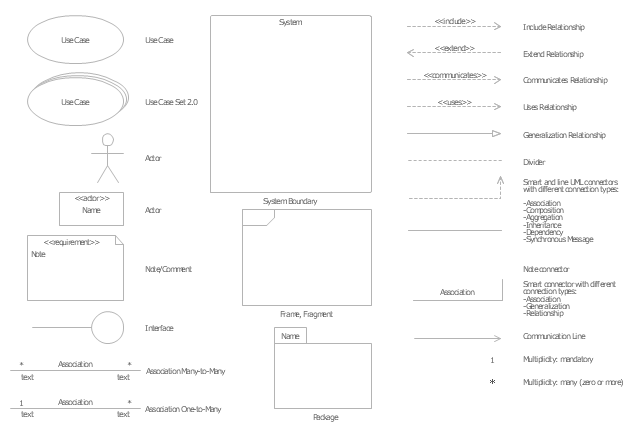
The vector stencils library "UML use case diagrams" contains 25 symbols for the ConceptDraw PRO diagramming and vector drawing software.
"Use case diagrams are usually referred to as behavior diagrams used to describe a set of actions (use cases) that some system or systems (subject) should or can perform in collaboration with one or more external users of the system (actors). Each use case should provide some observable and valuable result to the actors or other stakeholders of the system. ...
Use case diagrams are in fact twofold - they are both behavior diagrams, because they describe behavior of the system, and they are also structure diagrams - as a special case of class diagrams where classifiers are restricted to be either actors or use cases related to each other with associations. ...
Use case is usually shown as an ellipse containing the name of the use case. ...
Name of the use case could also be placed below the ellipse. ...
If a subject (or system boundary) is displayed, the use case ellipse is visually located inside the system boundary rectangle. Note, that this does not necessarily mean that the subject classifier owns the contained use cases, but merely that the use case applies to that classifier. ...
A list of use case properties - operations and attributes - could be shown in a compartment within the use case oval below the use case name. ...
Use case with extension points may be listed in a compartment of the use case with the heading extension points. ...
A use case can also be shown using the standard rectangle notation for classifiers with an ellipse icon in the upper right-hand corner of the rectangle and with optional separate list compartments for its features. ...
Subject (sometimes called a system boundary) is presented by a rectangle with subject's name, associated keywords and stereotypes in the upper left corner. Use cases applicable to the subject are located inside the rectangle and actors - outside of the system boundary. ...
Standard UML notation for actor is "stick man" icon with the name of the actor above or below of the icon. Actor names should follow the capitalization and punctuation guidelines for classes. The names of abstract actors should be shown in italics. ...
Custom icons that convey the kind of actor may also be used to denote an actor, such as using a separate icon(s) for non-human actors. ...
An actor may also be shown as a class rectangle with the standard keyword «actor», having usual notation for class compartments ...
An actor can only have binary associations to use cases, components, and classes. ...
An association between an actor and a use case indicates that the actor and the use case somehow interact or communicate with each other.
Only binary associations are allowed between actors and use cases.
An actor could be associated to one or several use cases. ...
A use case may have one or several associated actors." [uml-diagrams.org/ use-case-diagrams.html]
The example "Design elements - UML use case diagrams" is included in the Rapid UML solution from the Software Development area of ConceptDraw Solution Park.
UML use case diagram symbols
- Entity Relationship Diagram Symbols | Data Flow Diagram Symbols ...
- Basic Flowchart Symbols and Meaning | Audit Flowchart Symbols ...
- Entity Relationship Diagram Symbols and Meaning ERD Symbols ...
- Entity Relationship Diagram - ERD - Software for Design Crows Foot ...
- Components of ER Diagram | Entity Relationship Diagram Symbols ...
- Mechanical Drawing Symbols | Process Flowchart | Basic Flowchart ...
- Data Flow Diagram Symbols . DFD Library | Basic Flowchart ...
- Basic Flowchart Symbols and Meaning | Workflow Diagram Symbols ...
- Electrical Drawing Software | How To use House Electrical Plan ...
- Basic Flowchart Symbols and Meaning | IDEF0 Flowchart Symbols ...
- Basic Flowchart Symbols and Meaning | Process Flowchart | Data ...
- Basic Flowchart Symbols and Meaning | Process Flowchart ...
- Process Flowchart | Entity Relationship Diagram Symbols and ...
- Process Flowchart | Basic Flowchart Symbols and Meaning | Data ...
- Block Diagram Symbols
- Basic Flowchart Symbols and Meaning | Entity Relationship ...
- Basic Flowchart Symbols and Meaning | Workflow Diagram Symbols ...
- How To Draw A Reflected Ceiling Plan
- Value Stream Mapping Symbols | Basic Flowchart Symbols and ...