HelpDesk
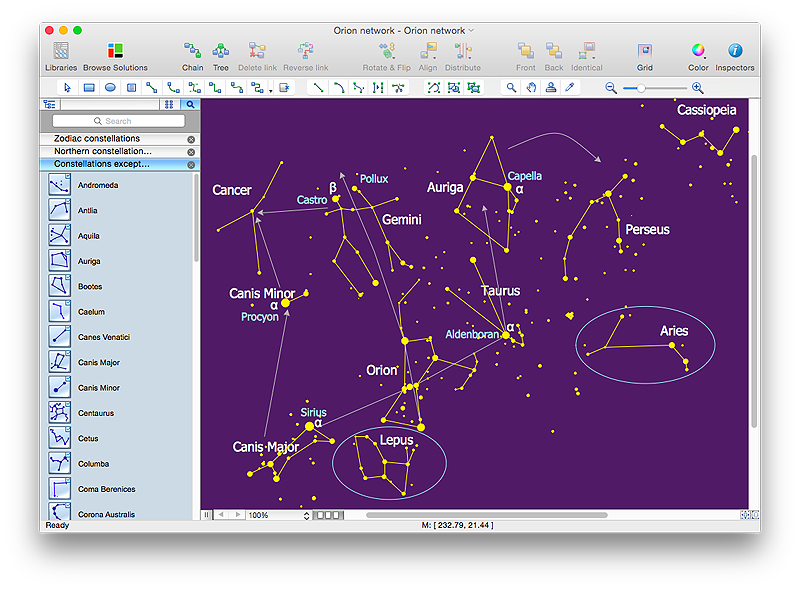
How to Draw a Сonstellation Сhart
Astronomic maps are used to locate stars, planets and other objects in the sky for a certain date, time and observing location. ConceptDraw Astronomy solution can be used as a tool for creating astronomy maps, charts and illustrations that contains astronomy symbols of constellations, galaxies, stars and planets. It allows you to draw the map of any constellation quickly and easily using the special templates and vector stencils libraries.HelpDesk
How to Draw the Different Types of Pie Charts
Using the Pie Chart, you can visually estimate the relative contribution that different data categories contribute to a whole value. The pie chart displays the statistics in a visual format. The main use of pie charts to show comparisons. The larger piece of the pie, the more the value of this value compared to the rest. Various applications of pie charts can be found in business and education. For business, pie charts can be used to compare the success or failure of the goods or services. They may also be used to display the business market share.HelpDesk
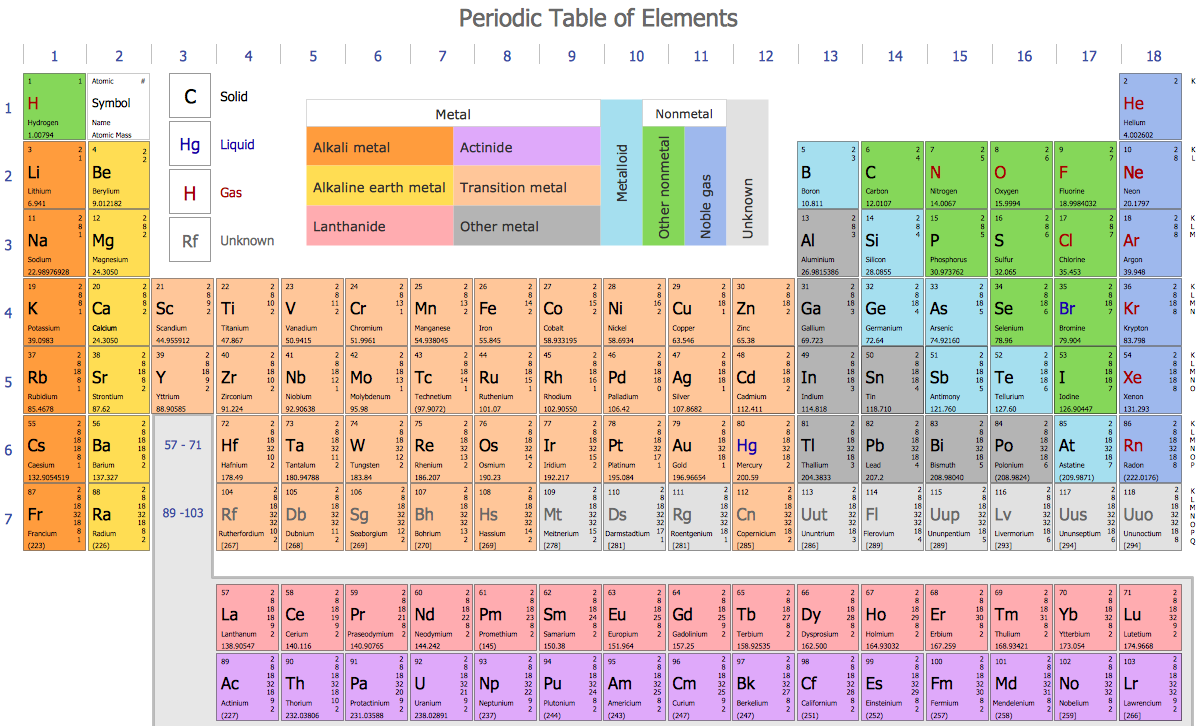
How to Draw Chemistry Structures
Making chemistry drawings for science and education purposes involves many different elements that can be managed using ConceptDraw PRO. ConceptDraw Chemistry solution can be used as a tool for creating chemical schemes and diagrams of chemical lab set-ups and labware, formulas, reaction schemes, and molecular structures. With ConceptDraw PRO you can easily create and communicate chemistry drawings of any complexity.Bio Flowchart Lite
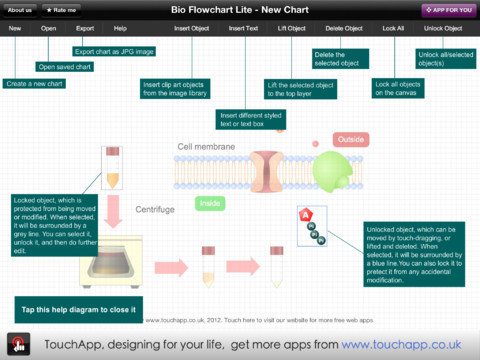
This app targets to help teachers and students to create vivid and professional biological flowcharts and diagrams in an easy way.- Designs To Draw On Educational Chart
- Design elements - Education charts | How to Draw a Scatter ...
- Educational Chart In The Topic Drawing
- Zodiac constellations - Vector stencils library | Constellation Chart ...
- How to Draw a Сonstellation Сhart | How to Create Education ...
- Design elements - Education charts | Education infogram 5 ...
- How to Draw an Organization Chart | Organizational chart - New ...
- Educational Charts Chem Bio Phy Maths
- How to Draw a Сonstellation Сhart | Constellation Chart | Sketching ...
- Education | Sketching Software | Constellation Chart | Constellation ...
- How to Draw a Сonstellation Сhart | Constellation Chart | Astronomy ...
- Design elements - Education charts | Design elements - Picture bar ...
- Constellation Chart | Sketching Software | Illustration Software | Easy ...
- How to Draw an Organization Chart | Organizational Structure | How ...
- How to Draw Pictorial Chart . How to Use Infograms | Flowchart ...
- Education | Presentations in Educational Process | Design elements ...
- Design elements - Greek letters | Education | Scientific Symbols ...
- Design elements - Education charts | Line Graph | How to Create a ...
- ConceptDraw Arrows10 Technology | Diagram Of Flow Chart Of ...
- Beautiful Education Drawing


