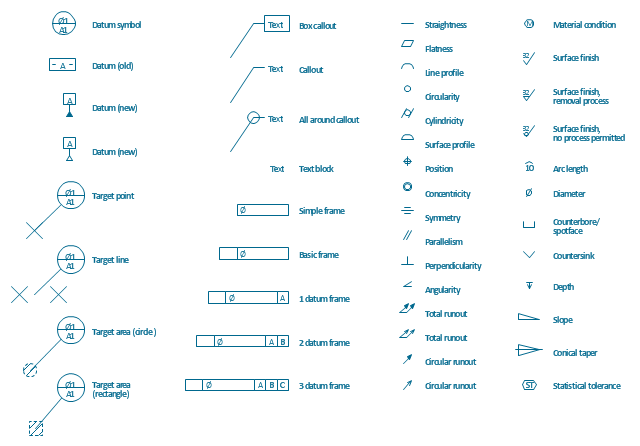
The vector stencils library "Dimensioning and tolerancing" contains 45 symbols of geometric dimensions and mechanical tolerances, geometric symbols, callouts, and text boxes and inserts.
Use these geometric dimensioning and tolerancing (GD&T) shapes to create annotated mechanical drawings.
"Geometric dimensioning and tolerancing (GD&T) is a system for defining and communicating engineering tolerances. It uses a symbolic language on engineering drawings and computer-generated three-dimensional solid models that explicitly describes nominal geometry and its allowable variation. It tells the manufacturing staff and machines what degree of accuracy and precision is needed on each controlled feature of the part. GD&T is used to define the nominal (theoretically perfect) geometry of parts and assemblies, to define the allowable variation in form and possible size of individual features, and to define the allowable variation between features." [Geometric dimensioning and tolerancing. Wikipedia]
The shapes example "Design elements - Dimensioning and tolerancing" was created using the ConceptDraw PRO diagramming and vector drawing software extended with the Mechanical Engineering solution from the ConceptDraw Solution Park.
Dimensioning and tolerancing symbols
Network Diagram Software


Design Element: Rack Diagram for Network Diagrams
.png)
 Cisco Network Diagrams
Cisco Network Diagrams solution extends ConceptDraw DIAGRAM with the best characteristics of network diagramming software. Included samples, templates and libraries of built-in standardized vector Cisco network icons and Cisco symbols of computers, network devices, network appliances and other Cisco network equipment will help network engineers, network designers, network and system administrators, as well as other IT professionals and corporate IT departments to diagram efficiently the network infrastructure, to visualize computer networks topologies, to design Cisco computer networks, and to create professional-looking Cisco Computer network diagrams, Cisco network designs and schematics, Network maps, and Network topology diagrams in minutes.
 Fault Tree Analysis Diagrams
This solution extends ConceptDraw DIAGRAM.5 or later with templates, fault tree analysis example, samples and a library of vector design elements for drawing FTA diagrams (or negative analytical trees), cause and effect diagrams and fault tree diagrams.
- Mechanical Design Symbols Used In Parts Design
- Mechanical Drawing Symbols | Design elements - Dimensioning ...
- Mechanical Drawing Symbols | Design elements - Dimensioning ...
- Mechanical Drawing Symbols | Design elements - Dimensioning ...
- Mechanical Drawing Symbols | Design elements - Dimensioning ...
- Mechanical Drawing Symbols | Basic Flowchart Symbols and ...
- Mechanical Drawing Symbols | Design elements - Dimensioning ...
- Mechanical Drawing Symbols | Design elements - Dimensioning ...
- Design elements - Dimensioning and tolerancing | Design elements ...
- Design elements - Dimensioning and tolerancing | Process Flow ...
- Design elements - Dimensioning and tolerancing | Basic Flowchart ...
- Design elements - Dimensioning and tolerancing | Examples of ...
- Mechanical Drawing Symbols | Geometric Dimensions And ...
- Mechanical Drawing Symbols | CAD Drawing Software for Making ...
- Technical Drawing Software | How to Create a Mechanical Diagram ...
- Symbol Used In Mechanical Engienering
- Machining Symbol Of Machine Design For Mechanical Engg Drawing
- Design elements - Dimensioning and tolerancing | Dimensioning ...
- Mechanical Drawing Symbols | Elements location of a welding ...
- Mechanical Drawing Symbols | Technical Drawing Software ...