ConceptDraw PRO DFD Software

The vector stencils library "DFD, Gane-Sarson notation" contains 12 DFD elements.
Use it for drawing data flow diagrams (DFD) using Gane-Sarson notation in the ConceptDraw PRO diagramming and vector drawing software extended with the Data Flow Diagrams solution from the Software Development area of ConceptDraw Solution Park.
Use it for drawing data flow diagrams (DFD) using Gane-Sarson notation in the ConceptDraw PRO diagramming and vector drawing software extended with the Data Flow Diagrams solution from the Software Development area of ConceptDraw Solution Park.
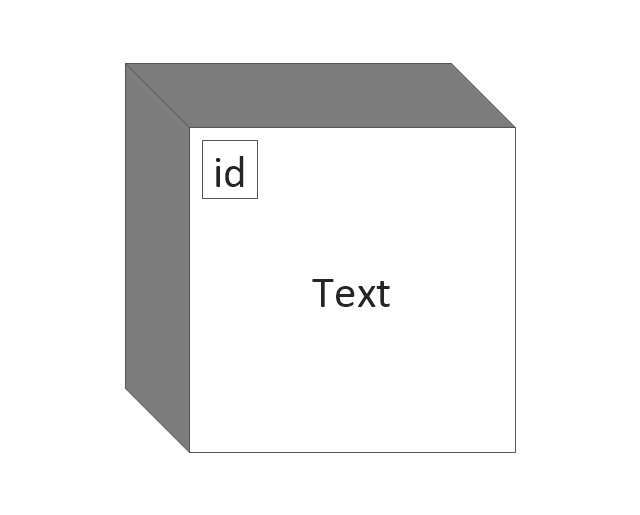
External Entity
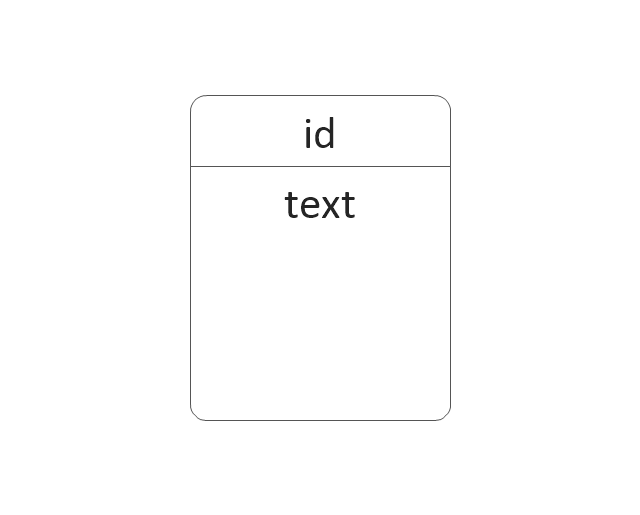
Process
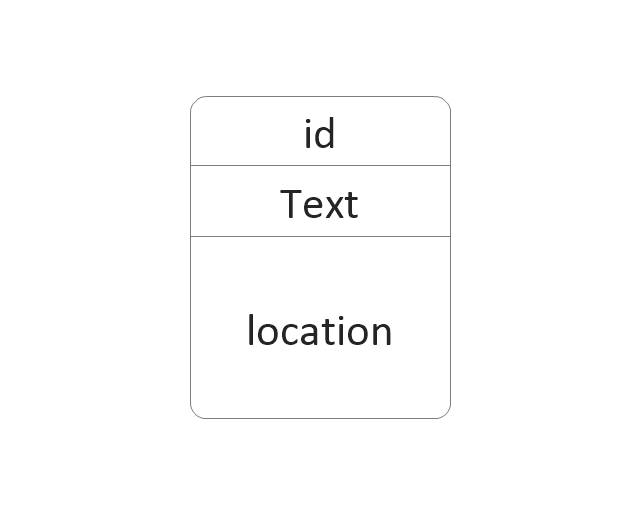
Process w / Location
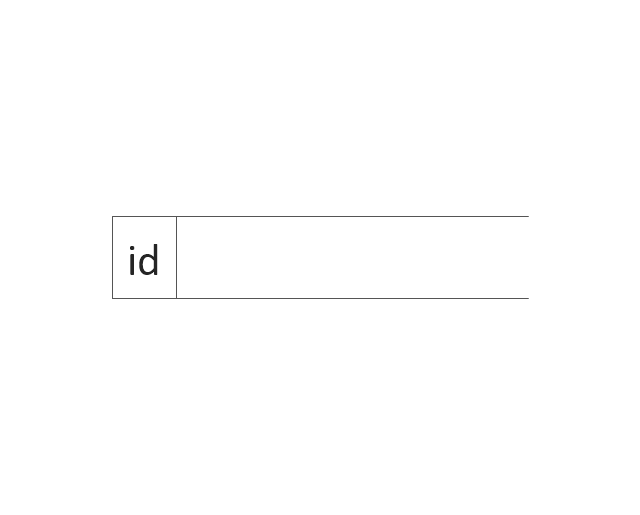
Data Store
Jump
Angled Connector
Angled Connector 2
Top to Bottom Variable
Bottom to Side
Side to Side
Side to Same Side
Top to Top Side
HelpDesk
How to Create a Data Flow Diagram using ConceptDraw PRO
 example")
The Data flow diagram (DFD) example "Payment for goods using UPS code scanner" shows data flow in process of payment for goods in the shop using the MaxiCode scanner.
"MaxiCode is a public domain, machine-readable symbol system originally created and used by United Parcel Service. Suitable for tracking and managing the shipment of packages, it resembles a barcode, but uses dots arranged in a hexagonal grid instead of bars. MaxiCode has been standardised under ISO/ IEC 16023.
A MaxiCode symbol (internally called "Bird's Eye", "Target", "dense code", or "UPS code") appears as a 1 inch square, with a bullseye in the middle, surrounded by a pattern of hexagonal dots. It can store about 93 characters of information, and up to 8 MaxiCode symbols can be chained together to convey more data. The centered symmetrical bullseye is useful in automatic symbol location regardless of orientation, and it allows MaxiCode symbols to be scanned even on a package traveling rapidly." [MaxiCode. Wikipedia]
This example of data flow diagram (Gane & Sarson notation) was created using the ConceptDraw PRO diagramming and vector drawing software extended with the Data Flow Diagrams solution from the Software Development area of ConceptDraw Solution Park.
DFD
---payment-for-goods-using-ups-code-scanner.png--diagram-flowchart-example.png)
"Data flow diagrams are one of the three essential perspectives of the structured-systems analysis and design method SSADM. The sponsor of a project and the end users will need to be briefed and consulted throughout all stages of a system's evolution. With a data flow diagram, users are able to visualize how the system will operate, what the system will accomplish, and how the system will be implemented. The old system's dataflow diagrams can be drawn up and compared with the new system's data flow diagrams to draw comparisons to implement a more efficient system. Data flow diagrams can be used to provide the end user with a physical idea of where the data they input ultimately has an effect upon the structure of the whole system from order to dispatch to report. How any system is developed can be determined through a data flow diagram model.
In the course of developing a set of levelled data flow diagrams the analyst/ designers is forced to address how the system may be decomposed into component sub-systems, and to identify the transaction data in the data model.
Data flow diagrams can be used in both Analysis and Design phase of the SDLC.
There are different notations to draw data flow diagrams (Yourdon & Coad and Gane & Sarson), defining different visual representations for processes, data stores, data flow, and external entities." [Data flow diagram. Wikipedia]
The DFD (Yourdon and Coad notation) example "Process of account receivable" was created using the ConceptDraw PRO diagramming and vector drawing software extended with the Data Flow Diagrams solution from the Software Development area of ConceptDraw Solution Park.
Data Flow Diagram

HelpDesk
Accounting Information Systems Flowchart Symbols

- Difference Between Context Diagram And Data Flow Diagram
- What Is The Difference Between An External Entity And A Process In
- What Is An External Entity In Software Engineering
- Data Flow Diagram Process
- What Is The Dofference Between An External Entity And A Process ...
- Data flow Model Diagram | Data Flow Diagram Model | Structured ...
- Difference Between Context Diagram And Dfd
- Differences Between Yourdon And Ssadam Techniques
- Difference Between Gane Ad Sarson And Youron Symbols
- Difference Between Different Levels Of Data Flow Diagram
- DFD - Process of account receivable | Data Flow Diagram | Data ...
- Differences Between Gane And Sarson And Yourdon Symbols
- Difference Between Dfd And Erd In Point Form
- Data structure diagram with ConceptDraw PRO | Data Flow Diagram ...
- Difference Between Data Flow Diagram And Entity Relationship
- Difference Btwn Data Flow Diagrams And A Rich Picture
- Difference Between Data Flow Diagram And Architecture Diagram
- Data Flow Diagram With Easy Business Example
- Difference Between Dfd And Context Diagram
- Basic Flowchart Symbols and Meaning | Data Flow Diagram ...