"A decision tree is a decision support tool that uses a tree-like graph or model of decisions and their possible consequences, including chance event outcomes, resource costs, and utility. It is one way to display an algorithm.
Decision trees are commonly used in operations research, specifically in decision analysis, to help identify a strategy most likely to reach a goal. ...
A decision tree is a flowchart-like structure in which internal node represents test on an attribute, each branch represents outcome of test and each leaf node represents class label (decision taken after computing all attributes). A path from root to leaf represents classification rules.
In decision analysis a decision tree and the closely related influence diagram is used as a visual and analytical decision support tool, where the expected values (or expected utility) of competing alternatives are calculated.
A decision tree consists of 3 types of nodes:
(1) Decision nodes - commonly represented by squares.
(2) Chance nodes - represented by circles.
(3) End nodes - represented by triangles.
Decision trees are commonly used in operations research, specifically in decision analysis, to help identify a strategy most likely to reach a goal." [Decision tree. Wikipedia]
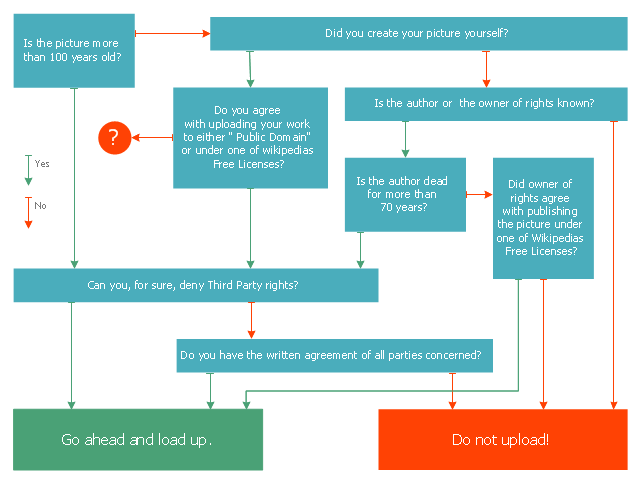
This marketing diagram sample was redesigned from the Wikimedia Commons file: Decision Tree on Uploading Imagesv2.svg.
[commons.wikimedia.org/ wiki/ File:Decision_ Tree_ on_ Uploading_ Imagesv2.svg]
The marketing diagram example "Decision tree" was created using the ConceptDraw PRO diagramming and vector drawing software extended with the Marketing Diagrams solution from the Marketing area of ConceptDraw Solution Park.
www.conceptdraw.com/ solution-park/ marketing-diagrams
Decision trees are commonly used in operations research, specifically in decision analysis, to help identify a strategy most likely to reach a goal. ...
A decision tree is a flowchart-like structure in which internal node represents test on an attribute, each branch represents outcome of test and each leaf node represents class label (decision taken after computing all attributes). A path from root to leaf represents classification rules.
In decision analysis a decision tree and the closely related influence diagram is used as a visual and analytical decision support tool, where the expected values (or expected utility) of competing alternatives are calculated.
A decision tree consists of 3 types of nodes:
(1) Decision nodes - commonly represented by squares.
(2) Chance nodes - represented by circles.
(3) End nodes - represented by triangles.
Decision trees are commonly used in operations research, specifically in decision analysis, to help identify a strategy most likely to reach a goal." [Decision tree. Wikipedia]
This marketing diagram sample was redesigned from the Wikimedia Commons file: Decision Tree on Uploading Imagesv2.svg.
[commons.wikimedia.org/ wiki/ File:Decision_ Tree_ on_ Uploading_ Imagesv2.svg]
The marketing diagram example "Decision tree" was created using the ConceptDraw PRO diagramming and vector drawing software extended with the Marketing Diagrams solution from the Marketing area of ConceptDraw Solution Park.
www.conceptdraw.com/ solution-park/ marketing-diagrams
Decision tree diagram
"Process Decision Program Chart (PDPC) is a technique designed to help prepare contingency plans. The emphasis of the PDPC is to identify the consequential impact of failure on activity plans, and create appropriate contingency plans to limit risks. Process diagrams and planning tree diagrams are extended by a couple of levels when the PDPC is applied to the bottom level tasks on those diagrams. ...
From the bottom level of some activity box, the PDPC adds levels for:
(1) identifying what can go wrong (failure mode or risks);
(2) consequences of that failure (effect or consequence);
(3) possible countermeasures (risk mitigation action plan)." [Process decision program chart. Wikipedia]
The process decision program chart (PDPC) example "Personal activity" was created using the ConceptDraw PRO diagramming and vector drawing software extended with the solution "Seven Management and Planning Tools" from the Management area of ConceptDraw Solution Park.
PDPC
---personal-activity.png--diagram-flowchart-example.png)
- Decision tree diagram | Decision Making | Influence Diagram ...
- Decision tree diagram | Marketing Diagrams | Fault Tree Analysis ...
- Decision Making | CORRECTIVE ACTIONS PLANNING. Risk ...
- Decision tree diagram | Marketing Diagrams | How To Create Root ...
- Types of Welding in Flowchart | Decision tree diagram | Computer ...
- Decision tree diagram | Influence Diagram | MS Visio Look a Like ...
- Decision Making | PROBLEM ANALYSIS. Root Cause Analysis Tree ...
- Example Decision Tree Diagram Software
- Decision Tree Software
- Decision Making | Block diagram - Customer decision making ...
- Decision Tree Example
- Accident analytic tree - FTA diagram | Decision Making | How To use ...
- Risk diagram (PDPC) - Template | Process decision program chart ...
- Online Decision Tree Maker
- Decision Making | Types of Flowcharts | | Decision Tree Symbols
- Decision Tree Algorithm Flowchart And Sequence Daigram
- Decision Tree Template Visio
- Process Flowchart | Decision Making | CORRECTIVE ACTIONS ...
- Decision Tree Diagram For Online Shopping Managment System
- Root cause analysis tree diagram - Template | PROBLEM ...